
Thursday 17 October 2024
Upcoming water availability update
Southern Basin
The aim of this service is to reduce some of the uncertainty about upcoming irrigation water availability, to assist with early and informed farm decision making, and to provide links to further information.
In this update:
- Summary
- Current Southern Basin water availability
– Total Southern Basin water storage
– Individual storage volumes - Current Southern Basin water allocations
- Allocation outlooks
- Carryover volumes
- Spillable account volumes
- Unused water volumes
- Six-month rainfall
- Current inflows – Murray & Goulburn
- Catchment condition
- Climate outlook
– November outlook
– Beyond the bureau outlook vibe
– Climate drivers - Streamflow forecast
- Useful web site
1. SUMMARY
- Currently Southern Basin storages remain at a relatively healthy 81% capacity, compared to relatively high 93% capacity at the same time last year.
- Water allocations on the Vic Murray system are 94% HRWS, 100% HRWS on the Goulburn, 44% GS on the NSW Murray, 34% GS on the Murrumbidgee, and 100% HS in South Australia.
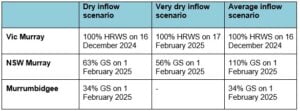
- With dry inflows the outlook is for the Vic Murray system to reach 100% HRWS by 16 December 2024, while the NSW Murray system would reach 63% GS by 1 February 2025, and the Murrumbidgee would remain on 34% GS on 1 February 2025.
- Large volumes of water were carried over in the Southern Basin into this irrigation season. In total 2,940GL were carried over on the Vic Murray, Goulburn, NSW Murray and Murrumbidgee of which 2,172GL is private water.
- There is currently a total of 619GL bounded in northern Victorian spillable water accounts of which 454GL is private water.
- April to October rainfall in the upper catchments has been mostly very much below average, resulting in low to very low streamflows.
- Murray inflows since April this year have had an Annual Exceedance Probability of 95%, meaning that in 95% of years we would have seen higher inflows.
- Typically, October is a month of high inflow for Southern Basin storages. However, like recent months this has not been the case and sufficiently heavy rainfall is needed on the dry catchments to turn things around.
- Over-all, rootzone soil moisture in the key upper catchments is lower for this time of year.
- The climate outlook for November to January is for neutral rainfall conditions across most of the Southern Basin.
- October to December inflows are forecast to be lower than median for key storages.
2. CURRENT SOUTHERN BASIN WATER AVAILABILITY
Total Southern Basin water storage
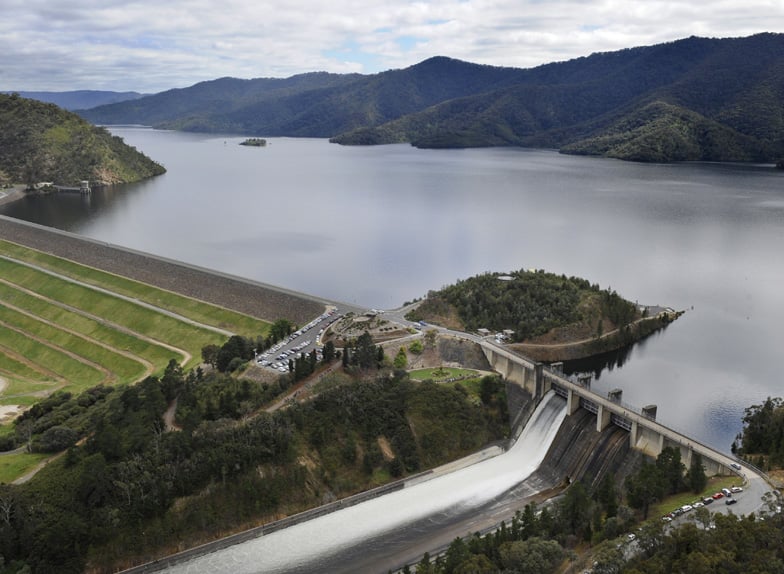
The bureau graph below shows the combined volume in southern Murray-Darling Basin storages as a percentage of capacity. Southern Basin storages include Lakes Dartmouth, Hume, Eildon, Burrinjuck, Blowering, Menindee(s), Victoria, Wyangala, and other smaller storages. Currently Southern Basin storages are at 81% capacity, compared to 93% capacity at the same time last year.
Southern Basin combined storage
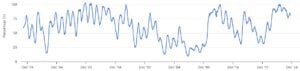
Source: Bureau MDB Water Information Portal.
Individual storage volumes
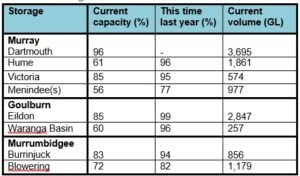
Source: Bureau MDB Water Information Portal. GMW.
For storage capacities in other valleys refer to the Bureau MDB Water Information Portal.
3. CURRENT SOUTHERN BASIN WATER ALLOCATIONS
Relatively small allocation increases were made on the Victorian Murray, Broken, and Campaspe systems earlier this week. Allocations remain the same on other key Southern Basin systems.
Southern Basin water allocations (%)
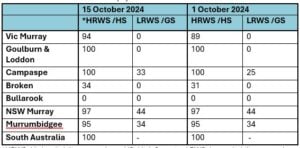
*HRWS: High-reliability water share. HS: High Security. LRWS: Low-reliability water share. GS: General Security.
Sources: NVRM. NSW government. MDBA.
NSW Murray: 44% GS allocation plus 40% carryover brings the total to 84% GS, or 1,321GL.
Murrumbidgee: 34% GS allocation plus 27% carryover brings the total to 61% GS, or 1,061GL.
4. ALLOCATION OUTLOOKS
Allocation outlooks were updated earlier this week.
Sources: NVRM. NSW DCCEEW.
5. CARRYOVER VOLUMES
Volumes carried over into 2024-25
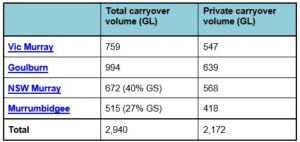
Source: NVRM. NSW DCCEEW.
6. SPILLABLE WATER ACCOUNT VOLUMES
Volume in spillable accounts (GL)
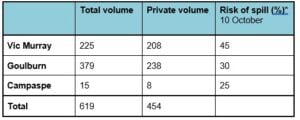
*The risk of spill was updated last week and refers to Victoria’s share of Lake Hume on the Murray system, Lake Eildon on the Goulburn, and Lake Eppalock on the Campaspe system. Source: NVRM.
When the risk of spill for each system falls below the 10% threshold, water in spillable accounts is released for use and trade.
7. UNUSED AVAILABLE WATER
Unused available water (GL)
Source: Vic Water Register.
8. SIX-MONTH RAINFALL
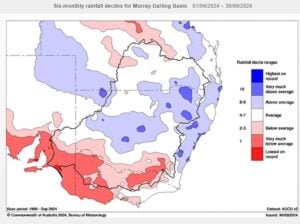
Source: Bureau.
9. CURRENT INFLOW – MURRAY AND GOULBURN
Murray inflows are significantly below the long-term average, and below last year’s inflows. In fact, the MDBA reports that inflows since April this year have had an Annual Exceedance Probability of 95%, meaning that in 95% of years we would expect to see higher inflows over this period than we have observed this year. Typically, October is a month of high inflows, but like recent months this has not been the case and sufficiently heavy rainfall is needed on the dry catchment to turn things around.
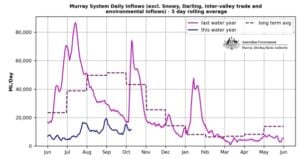
Source: MDBA.
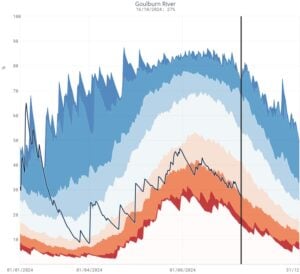
Lake Eildon inflows from May to September this year have been tracking close to the dry scenario.
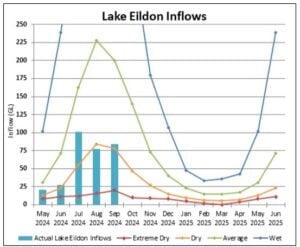
Source: NVRM.
10. CATCHMENT CONDITION
The bureau graphs below show that rootzone soil moisture (top 1m) in the upper Murray and Goulburn catchments is lower for this time of year.
Rootzone soil moisture, upper-Murray
Rootzone soil moisture, Goulburn catchment
Source: Bureau.
Rootzone soil moisture levels for other locations can be viewed on the bureau’s Australian Water Outlook web site.
11. CLIMATE OUTLOOK
November outlook
The bureau’s outlook for November is basically neutral for most of the Southern Basin. Confidence in the outlook is wavering based on recent performance, but we will take a deeper look at the outlook and how it can be used in decision making.
November rainfall outlook
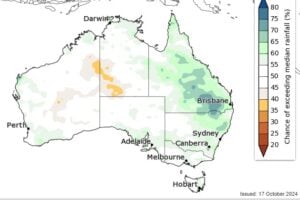
Source: Bureau.
Beyond the bureau outlook vibe
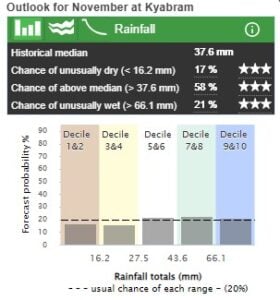
The colour coding on the bureau outlook map above shows a 50-60% chance of exceeding median rainfall for November in the GMID. While these are not compelling odds, further detail about the outlook is shown in the bureau’s Forewarned is Forearmed figure below which can be generated for any location.
Source: Bureau.
The above figure shows a break-down of the probabilities shown in the coloured November rainfall outlook map, and the figure can be thought of as a roulette wheel. For example, it shows a 17% probability of a ‘Decile 1&2’ event in November for Kyabram (less than 16.2mm), and a 21% chance of a ‘Decile 9&10’ event (greater than 66.1mm). Other indicators that can be used to inform decision making include what the other climate models are forecasting, the consistency of the outlooks over a period of time, and what the climate drivers are doing.
Climate drivers
The bureau released a climate driver update earlier this week. The El Nino-Southern Oscillation (ENSO) remains neutral. The chance of a La Nina event developing in the coming months has decreased compared to recent outlooks. If a La Nina should develop it is forecast to be relatively weak and short-lived.
The Indian Ocean Dipole (IOD) is currently neutral and is likely to remain neutral for the rest of the year.
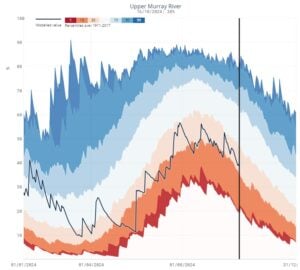
12. STREAMFLOW FORECAST
Inflows into Lakes Dartmouth, Hume and Eildon for October to December are forecast to be lower than median.
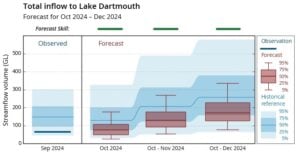
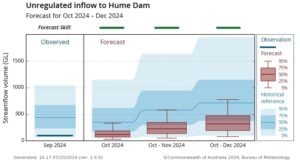
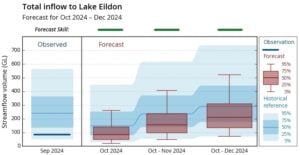
Source: Bureau.
For streamflow forecasts for other locations visit the bureau’s Australian Water Outlook.
————————————————————————————————————————————————————————————————————
13. USEFUL WEB SITES – for more information related to upcoming irrigation water availability
Rainfall
Recent rainfall. Map. Rainfall for the past day, week or months. BoM.
Recent rainfall. Map. Australian weather stations. Daily, weekly, monthly rainfall all years. BoM.
Recent rainfall. For select Victorian locations. Past 7 days. BoM.
Recent rainfall. Rainfall in the last 24 hours, since 9am, or in last hour. BoM.
Rainfall since 9am. Updated every half hour. For select locations. Rainfall (temperaturre and wind) shown on map as coloured text. Click on “weather observations” (bottom right of screen). Double click on the weather station (location) on the map for more details. “Rain radar” web site. BoM.
Forecast rainfall. Map. For next 4-day or 8-day period, or for any particular day over the next 5 days. BoM.
Forecast rainfall. For nominated locations. 7-day outlook. Forecast rainfall (wind and temperature) given in 3-hour windows. “MetEye” web site. BoM.
Chance of at least. BoM
Chance of at least. Climate services for agriculture.
MDBA Weekly River Murray Report. Provides a weekly review of rainfall and lots of other important updates for the connected southern MDB.
Streamflow response and inflows
Murray system. MDBA Weekly Report. Inflow graphs are at the back of the report. Compares recent inflows with long-term averages. Weekly streamflow response commentary is also provided at the front of the report.
Murray system. Click on a site (eg.Hinnomunjie or Jingellic) and select the “Flow” tab. Updated daily. MDBA.
Goulburn system. Doherty’s, Jamieson, Gerrans Bridge and Glen Esk are some monitoring sites above Lake Eildon. Updated daily. GMW.
Goulburn Murray storage inflow data. Graphs of relative monthly inflows. Analysis of monthly and year-to-date inflows. NVRM.
Campaspe, Broken, Loddon, Ovens and Kiewa Basins. Updated through the day. GMW.
River flood condition. Current. Graphs of recent river height relative to minor, moderate and major flood levels. BoM.
Flood class level. Shows minor, moderate and major flood levels for different monitoring sites. BoM.
Annual streamflow differences and streamflow data. For many Australian locations (“Hydrological Reference Stations”.) Daily, monthly and annual streamflow data and analysis. BoM.
Water data online. Shows flow data (often measured as cubic metres per second “cumec”!) and useful analysis including monthly mean flows for hydrologic reference stations around Australia. BoM.
Surface water monitoring sites. Vic. Stream level. Streamflow data and reports. DELWP.
Streamflow – NSW. Shows current, historical and forecast flow rates and river levels for NSW river gauges. (Select a location on the map and choose the “gauges” tab.) Water Insights. WaterNSW.
Past, current, forecast and projected run-off maps. Forecast – for each of next 3 months. Projected – 2030, 2050, 2070 and 2085. BoM – AWO.
Past, current, forecast and projected evapotranspiration maps. Forecast – for each of next 3 months. Projected – 2030, 2050, 2070 and 2085. BoM – AWO.
Streamflow forecasts
Seasonal streamflow forecast. Up to 3-month forecast. eg. Forecast inflows for Lakes Hume, Dartmouth, Eildon, Eppalock or Nillahcootie. BoM.
7-day streamflow forecast. eg. For locations in the upper-Murray, upper-Goulburn, Campaspe or Loddon. BoM.
Murray system. Click on a site (eg. Hinnomunjie or Jingelic) and select the “Flow Forecast” tab. 7-day forecast. MDBA.
Catchment condition
Current relative long-term rootzone soil moisture. Map and graph. eg. Type “Upper Murray River,” “Goulburn River” or “Broken River” into the Search Bar. BoM.
Historical, forecast and projected soil moisture. Forecast – for each of next 3 months. Projected – 2030, 2050, 2070 and 2085. BoM – AWO.
Seasonal water determinations
Current Northern Vic allocations. Current allocations for the different Northern Victorian irrigation systems. NVRM.
Historical Northern Vic allocations. Historical allocations data for the different Northern Victorian irrigation systems, back to 1994-95. NVRM.
Current and historical NSW allocations. Water Alloction Statements, iIncluding NSW Murray and Murrumbidgee. DPIE.
Current and historical SA allocations. Water Allocation Statements and pre-season announcements. DEW.
MDBA Weekly River Murray Update. Summary of current water allocations for different vallies in the sMDB, usually on the last page of the report.
Water allocation outlooks
Northern Vic. Current outlook for the different Northern Vic irrigation systems. NVRM
NSW. Includes NSW Murray and Murrumbidgee. The water outlook is included in the relevant Water Allocation Statements, usually on the back page of the report. DPIE.
Northern Vic Water Balance (“rocket”) diagrams. Graph showing a breakdown of the water in store and water commitments, for each Northern Vic irrigation district. NVRM.
Climate outlook
Climate outlook. Weeks, months and seasons. The one-week and two-week forecast maps and graphs are updated daily. Forecasts for months and seasons ahead are updated every Thursday. BoM.
Climate Driver Update. Over-all summary. Pacific Ocean. Indian Ocean. Southern Ocean. Sea surface. Issued fortnightly. BoM.
Outlook scenario for rainfall amount. Map showing chance of rainfall amount for next week, fortnight, month or 3-month period. BoM.
Chance of at least (rainfall). Map showing probabilities of receiving a specified amount of rain for next week, fortnight, month or 3-month period. BoM.
The Fast Break. A farmer-oriented update of seasonal climate drivers and outlooks, including a summary of rainfall predictions for the next 3 months from 12 different climate models. AgVic.
Climate driver tool. Interactive tool that enables you to explore how rainfall at your selected location has been influenced by different climate driver phases, in the past. The tool also provides analysis of long-term rainfall records. AgVic, GRDC and SARDI.
My Climate View. Designed to help Australian farmers better understand the climate risks and opportunities facing them over the next 50 years. BoM and CSIRO.
Weather warnings
Victorian warnings. Summary of valid weather warnings issued, including floods. BoM.
River Height and flood class. Provides data on current river height, flood class and whether rising, falling or steady. Table and graphs. BoM.
Streamflow flooding and recent rainfall. Shows river condition (flooding) for monitoring sites across catchments. Map. BoM.
Water storage
MDBA River Murray Weekly Report (produced on Fridays):
– Graph showing ‘MDB Active Storage’, recent and over the last 20 years. This graph only appears monthly, usually in the first week of the month
– A summary of storage volumes and weekly volume changes for southern MDB storages are given in tables (usually on about page 3).
Northern Vic Resource Manager. Provides a breakdown of volumes currently available in allocation accounts, new allocation volumes in the current season, volumes carried over into the season, volumes in spillable accounts and net trade – for each irrigation district and for private, environmental and Water Corp holdings.
Goulburn Murray storages. Shows current storage levels, weekly change and storage at the same time last year, for Murray, Goulburn, Ovens, Broken, Campaspe, Loddon and Bullarook storages. Graphs of storage levels this year, compared to previous years are shown. Updated regularly. GMW web site.
Goulburn Murray storages. Shows storage level graphs and data for Murray, Goulburn, Ovens, Broken, Campaspe, Loddon, Kiewa and Bullarook storages. Updated every 15 minutes. GMW.
Goulburn Murray storages. Shows graphs and data for observed volume, level and percentage full for GM storages. (Select ‘System Status Report’, choose which ‘Basin’, select ‘Storage’, then select your storage.) GMW.
Murray storages. Click on the storage (eg. Hume Dam) to get ‘percent full’ and current storage volumes. This site is regularly updated. MDBA.
Murray Darling Basin storages. Shows ‘percent full’ figures for storages in the Basin. Also provides ‘percent full’ for ‘Southern Basin total.’ Updated fortnightly. The fortnightly MD Basin Storage Report featuring a map with current MDB storage volumes, can be downloaded from this page. MDBA.
Murray Darling Basin storages. Shows dam volume and ‘percent full’ figures for Basin storages, different systems (eg. Murray and Goulburn) compared to last year, and a break-down of how the water is shared (eg. private, environment, water corporation). Updated regularly. BoM.
NSW storages. Provides “percent full”, current volume, inflow and release data for NSW storages. Updated regularly. (Select a location and the “storage” tab. Water Insights – WaterNSW.
Archived Basin storage reports. Provides an archive of fortnightly reports showing MDB water in storages, back to 2009. MDBA.
Carryover volumes
Northern Vic Resource Manager. Shows carryover volumes for each (Northern Vic) irrigation district.
NSW. Carryover percentages for NSW Murray and Murrumbidgee systems are usually included in the Water Allocation Statements (usually in a table on page 1). DPIE.
- SA. Developments regarding SA carryover and whether or not it is available in an irrigation season, are typically found in the pre-season announcements.
Vic Carryover Tool. To help you work through carryover scenarios for your unique Vic farm situation. DELWP (Vic Water Register).
Water availability
Unused water – Vic. Shows volume of carryover, allocation, use, net trade, write-off and a graph of unused available water in recent seasons for each northern Vic valley. Vic Water Register.
Available water by owner type – Vic. Shows carryover, allocation, trade and spill volumes for Vic valleys. Private, environment and Water Corp ownership categories. Current and previous years. Scroll down for Further Insights. Vic Water Register.
Water allocated and used – NSW. Shows the volume of water allocated and used against entitlement type and ownership class. This information is shown for the current year or previous years. (Select a location and click on the “allocation” or the “historical” tab.) Water Insights. WaterNSW.
River Murray flow and use in SA. Shows river flow into SA and a break-down of water use. Updated quraterly. SA Dept of Env and Water.
River Murray Water Calculator – SA. Shows SA allocation and entitlement volumes for different water classes under different water availability scenarios. SA Dept of Env and Water.
Southern Basin water availability. Shows the current sMDB water volume compared to the same time last year, for the past 10 years, and since 1979. Gold!! BoM MDB Water Information Portal.
District water use and trade – Northern Vic
District Water Use. Water used in different Northen Victorian irrigation districts by private, environment and water corp owners. NVRM web site.
Net Trade for Districts. Trade in and trade out, for different Northen Victorian irrigation districts by private, environment and water corp owners. NVRM web site
Water available by owner type. Vic district carryover, allocation, trade and spill volumes. Vic Water Register.
Risk of spill announcements
Northern Victorian Resource Manager. Sometimes the Vic risk of spill information is included in the Seasonal Outlook announcements.
Current state shares in Murray storages
MDBA Storages. Displays the shares of the MDBA “Active Storages” (Lakes Hume, Dartmouth, Menindee and Victoria) for Vic, NSW and SA. This site also shows the relative “air space” for each share (Vic, NSW & SA). Scroll to the bottom of the page and click on the PDF for the latest update. MDBA.
Intervalley trade (IVT)
Goulburn IVT
Opportunity for allocation trade. Interactive tool. Vic Water Register web site.
Planned monthly IVT transfers. Scroll down to the heading “Planned Inter-Valley Trade Transfers.” GMW web site.
Goulburn to Murray trade rules. Be carefull to stay informed about the latest changes to Goulburn to Murray trade rules. Vic Water Register web site.
Barmah Choke
Barmah Choke trade balance. Current and historic trade balance data. MDBA web site.
Allocation trade opportunity. Interactive tool. Vic Water Register web site.
Murrumbidgee IVT
IVT Status. Provides the current Murrumbidgee IVT Account Balance, whether trade is open or closed and backgound information. WaterNSW site.
Annual plan for MDB IVT
MDBA River Murray System Annual Operating Outlooks. Outlines potential forward scenarios of IVT delivery for the irrigation season ahead – which can be useful if you want to gain a better understanding of how much water may be traded out of different valleys in the remainder of the season.
Water Market Outlook
ABARES Dashboard. Water Market Outlook for sMDB water allocation prices for wet, average and dry scenarios. Water market reports are also provided.
Water market information
Weekly Water Market Report. H2OX.
Weekly Newsletter. Ruralco.
Weekly Water Report. Waterfind.
Weekly Water Wrap. Waterpool.
Water reports. Aither.
Weekly Australian Climate, Water and Ag Update. ABARES
Aggregated MDB water listings – “WaterFlow.” Marsden Jacobs and Australian government.
WaterExchange. Water market and clearing house.
Water market summary dashboard. BoM
Vic water register. DEECA.
—————————————————————————-
This publication is provided solely for information purposes and no representation or warranty is made as to its quality, accuracy, completeness, suitability or fitness for any particular purpose. You should make your own inquiries as to its appropriateness and suitability for your particular circumstances. The State of Victoria as represented by its Department of Energy, Environment and Climate Action accepts no duty of care and disclaims all liability in relation to use of this publication.
Information in these updates is provided to assist irrigators make more informed and earlier farm maangement decisions related to upcoming irrigation water availability. The information is NOT intended to assist with financial decision making related to water investment or water trade.
Due to a need for the release of timely information, this report is not subject to rigorous checking and approval procedures. Figures provided in this report are entered manually and are subject to error. Information in this report needs to be checked with other sources.