
Thursday 1 May 2025
Upcoming water availability update
Southern Basin
The aim of this service is to reduce some of the uncertainty about upcoming irrigation water availability, to assist with early and informed farm decision making, and provide online links to help you actively keep up to date.
In this update:
- Summary
- Feature article: Water Availability boost
- Feature article: Managing changing water availability
- Feature article: 2024-25 irrigation requirement comparison
- Current Southern Basin water availability
– Combined Southern Basin water storage
– Individual storages - Anzac Day rain
- Southern Basin water allocations
- Storage volume breakdown – Private, environmental & water corporation portions
- Total water use to date versus total allocated and carried over
- Current unused available water volume
- Estimated unused available water volume at the end of this season
- System inflows
- Forecast rain – what global models are saying
- 2025-26 storage scenarios based on historical precedents
- 2025-26 water outlook
- Streamflow outlook
- Climate outlook
- Climate drivers
- Catchment soil moisture
- Carryover volumes 2024-25
- Useful web sites
1. SUMMARY
- The combined Southern Basin water storage is at 51% capacity, or 8,325GL, compared to 77% capacity at the same time last year, and an average of 57% over the last ten years.
- Welcome rain of 25 – 50mm was received in some western parts of the Southern Basin on Anzac Day helping to ease irrigation demand, while there were lower falls in eastern parts of the Basin including upper-catchments.
- Early last week (before Anza Day), the MDBA reported that irrigation demand remains relatively high, at Lake Mulwala.
- Since 15 August 2024, cumulative evapotranspiration (ETo) this season is 1,302mm and rainfall is 233mm, indicating an irrigation requirement of 1,069mm (10.7ML/ha) for our reference crop of pasture so far this irrigation season, at Kyabram.
- Modelled rootzone soil moisture (top 1m) in the upper-Murray and Goulburn catchment is drier for this time of year.
- Forecast inflows to the Menindee Lakes have increased to 800 – 1,200GL over coming months in response to the floods in the Northern Basin.
- The estimated unused available volume at the end of this season in the Victorian Murray is 690GL, and about 910GL in the Goulburn. This compares with unused available water volumes on 15 May last year, which were 1,030GL in the Victorian Murray, and 850GL in the Goulburn.
- In the NSW Murray, the over-all average General Security entitlement balance was 45% on 15 April 2025. At the end of last season 40% of the GS entitlement volume was carried over, into this season.
- The Bureau’s longer-term outlook continues for above average temperatures with unusually high daily maximum and minimum temperatures.
- Rainfall in the typical range is expected for the Southern Basin for May to July. Keeping in mind the past accuracy of the rainfall outlook is 65-75% this time of year.
- Historical storage volume precedents indicate there are a range of water availability scenarios that could play out over the rest of this year that need to be planned for.
- As the irrigation season draws to a close, now is a good time to revisit your water needs and farm management options for 2025-26 and beyond.
2. FEATURE ARTICLE: Water availability boost
Last week WaterNSW increased their forecast inflows to the Menindee Lakes to 800 – 1,200GL over coming months in response to the floods in the Northern Basin. Peak flows are expected to arrive in the Menindee Lakes in late May and early June. Currently, sufficient airspace is available to capture the forecast inflows. The water will be shared between Victoria, NSW and South Australia.
Welcome rain of 25 – 50mm was received in some western parts of the Southern Basin on Anzac Day, helping to ease irrigation demand, with lower falls in eastern parts including upper-catchments. (Refer to the ‘Recent rain’ section below for more details.)
Earlier last week, the MDBA reported that irrigation demands (at Lake Mulwala) remained relatively high.
Other good news about Southern Basin water availability next season is the healthy volume of Unused Available Water currently remaining in allocation accounts, most of which is likely to be carried over. (Refer to the ‘Current Unused Available Water Volume’ section below.)
Of concern is that in February this year the Northern Victorian Resource Manager (NVRM) reported that only enough water had been reserved this season to provide about 25% high-reliability water share (HRWS) or better in the Victorian Murray and Goulburn systems at the start of next season. Since February, storage inflows have remained low, while water use has continued to be high. Average inflows are required to secure 100% HRWS in the Victorian Murray and Goulburn systems. The next NVRM 2025-26 seasonal determination outlook will be released on 15 May.
Also of concern is the announcement by NSW Water that average inflows will only provide an allocation of 34% General Security in the NSW Murray next season.
Currently, there is a widening gap of water availability and water price between irrigation systems located above Barmah Choke versus below the Choke.
3. FEATURE ARTICLE: Managing changing water availability
As the irrigation season draws to a close, now is a good time to revisit your water needs and farm management options for 2025-26 and beyond.
Keeping informed, forward planning, being prepared to be agile, and being ready to make timely decisions are all part of better managing changing water availability.
If decisions are made early, more options are likely to be available. However, early decision making can involve the use of imperfect information because operational settings can change rapidly.
To make it easier for timely and considered decision making, it can help to identify and sequence possible events leading into a low water availability scenario in advance, and to identify your sweet-spots or trigger-points for planned action.
Having early conversations with your partner, employees, neighbour, trusted advisor, or water broker about managing changing water availability may also help, along with identifying ways to break bigger farm management decisions into smaller ones.
As well as different farm management options, there is a basket of water products available that can be used to better manage water supply risk. These water products include carrying over on your own LRWS or HRWS, parking on someone else’s water share, or on leased or purchased water share. Forward contracting water, leasing or purchasing water share, or using the allocation market at the spot price, can also be put in the mix.
The best farm management options and water products to use will depend on your unique situation, goals, and attitude to risk.
4. FEATURE ARTICLE: 2024-25 irrigation requirement comparison
Since 15 August 2024, cumulative evapotranspiration (ETo) this season is 1,302mm and rainfall is 233mm, indicating an irrigation requirement of 1,069mm (10.69ML/ha, 1,302mm minus 233mm) for our reference crop of pasture so far this irrigation season, at Kyabram – assuming a soil moisture deficit of zero at the start of the season, and minimal run-off and deep percolation losses.
The irrigation requirement at the same time last year was 801mm (8.01ML/ha), while the long-term average (2011-2024) irrigation requirement to this time of year is 872mm (8.72ML/ha), at Kyabram.

Data source: Bureau.
5. CURRENT SOUTHERN BASIN WATER AVAILABILITY
Combined Southern Basin water storage
The combined Southern Basin water storage is at 51% capacity, or 8,325GL, compared to 77% capacity at the same time last year, and an average of 57% over the last ten years.
The Bureau graph below shows the combined volume in Southern Basin storages as a percentage of capacity. These storages include Lakes Dartmouth, Hume, Eildon, Burrinjuck, Blowering, Menindee(s), Victoria, and other smaller storages.
Southern Basin combined storage (% capacity)

Source: Bureau MDB Water Information Portal.
Individual storages

Source: Bureau MDB Water Information Portal.
For storage capacities in other valleys refer to the Bureau MDB Water Information Portal.
6. ANZAC DAY RAIN
Locally, there was a mix of joy and disappointment with the Anzac Day rain depending on the location.
In a reversal of the typical rainfall pattern, generally the irrigated plains west of Echuca received around 1-2 inches (25-50mm), while less than an inch fell east of Echuca.
Unfortunately, the upper-Murray and upper-Goulburn catchments received only relatively light falls.
Rainfall totals included: Mildura 11mm. Swan Hill 35mm. Kerang 38mm. Echuca 20mm. Kyabram 19mm. Stanhope 12mm. Tatura 12mm. Rutherglen 0mm. Mansfield 0mm. Falls Creek 6mm. Mt Hotham 12mm. Mt Buller 1mm. Lake Dartmouth 2mm. Lake Eildon 13mm. Cairn Curran 15mm.

7. SOUTHERN BASIN WATER ALLOCATIONS
There was no increase in Murrumbidgee General Security allocations today (Thursday 1 May).
Southern Basin water allocations (%)

*HRWS: High-reliability water share. HS: High Security. LRWS: Low-reliability water share. GS: General Security.
Sources: NVRM. NSW government. MDBA.
NSW Murray: All carryover volumes have now been spilt, with GS allocations reaching the maximum annual limit of 110%.
Murrumbidgee: 39% GS allocation plus 27% carryover brings the total to 66% GS.
8. STORAGE VOLUME BREAKDOWN – PRIVATE, ENVIRONMENTAL & WATER CORPORATION PORTIONS
The pie-charts below show the volume of private, environmental, and water corporation water remaining in allocation accounts in the Victorian Murray and Goulburn, on 1 April 2025.


Data source: NVRM.
9. TOTAL WATER USE TO DATE VERSUS TOTAL ALLOCATED & CARRIED OVER
The graph below shows the total water use to date (30 April 2025), versus the total water allocated this season plus the total volume carried over into this season, for the Victorian Murray, Goulburn, and NSW Murray systems.
Please note that other factors impact on the volume of total unused available water including net trade, “write-off”, and “extraordinary items”.
Water usage to date – versus – water allocated plus carryover

Data source: Victorian Water Register. NSW Water.
10. CURRENT UNUSED AVAILABLE WATER VOLUME
In the Victorian Murray, the Unused Available Water volume has reduced since the last Upcoming Water Availability update (17 April 2025) and is substantially less than the same time last year and the same time in 2023.
In the Goulburn, the Unused Available Water volume has reduced since the last Upcoming Water Availability update (17 April 2025), is greater than this time last year, and markedly less than this time in 2023.


Data source: Vic Water Register.
Unused available water is the volume that has not been used and remains available in storage. It is committed to existing users, and is for use, trade, or carryover.
Unused available water volumes in other Victorian systems can be viewed at the Victorian Water Register.
11. ESTIMATED UNUSED AVAILABLE WATER VOLUME AT THE END OF THIS SEASON
Based on the current unused available water volume and last year’s water use for the remainder of the season, the estimated unused available volume at the end of this season in the Victorian Murray is 690GL, and about 910GL in the Goulburn.
This compares with unused available water volumes on 15 May last year, which were 1,030GL in the Victorian Murray, and 850GL in the Goulburn.
In the NSW Murray, the over-all average General Security entitlement balance was 45% on 15 April. At the end of last season 40% (672GL) of the GS entitlement volume was carried over into this season. Individual water users are able to carryover up to 50% of their entitlement in the NSW Murray.
12. SYSTEM INFLOWS
Murray and Goulburn system inflows remain below average.
Keep in mind that inflows this time of year are typically low and that the key inflow period is usually July to October, as shown by the average inflow traces in the two graphs below.
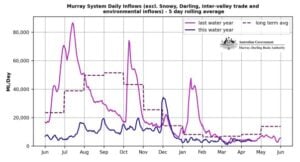
Source: MDBA.

Source: NVRM.
Inflow graphs for other Victorian storages are available at NVRM.
13. FORECAST RAIN – WHAT THE GLOBAL MODELS ARE SAYING
Four global models, ACCESS (Australian), ECMWF (European), GFS (United States), and ICON (German), are showing no rainfall events for the irrigated plains over the next 8-10 days.
In the longer-range forecast, ECMWF is showing some rain in northern Victoria on 14 May, at this stage.
The global models are at your fingertips on one handy WINDY web site (below).
Windy.com

14. 2025-26 STORAGE SCENARIOS BASED ON HISTORICAL PRECEDENTS
The graphs below show storage capacity changes in Hume Dam and Lake Eildon for years when there were similar volumes in storage on 30 April.
The graphs clearly show that based on historical precedents there are a range of storage volume scenarios that could play out over the rest of this year that need to be planned for.

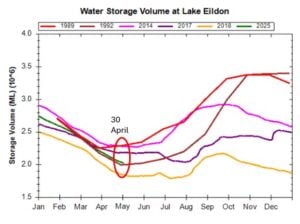
Source: GMW.
15. 2025-26 WATER OUTLOOK
Northern Victorian outlook – released 17 February 2025

Source: NVRM.
The northern Victorian 2025-26 outlook will be next updated on 15 May 2025.
2025-26 water outlooks for other northern Victorian systems can be viewed on the NVRM website.
NSW water outlook – released 15 April 2025
General Security allocations

Data source: NSW Water.
High Security allocations will likely be 97% in the NSW Murray, and 95% in the Murrumbidgee.
16. STREAMFLOW OUTLOOK
The Bureau’s latest streamflow outlook is for average to above average flows for Lakes Dartmouth and Eildon, but below average unregulated flows for Lake Hume, for April to June. (The May to July outlook has not been released yet.)
Keep in mind that inflows this time of year are typically low and that the key inflow period is usually July to October.


Source: Bureau.
17. CLIMATE OUTLOOK
Rainfall
The Bureau’s latest rainfall outlook (released last week) for May to July is for rainfall in the typical range. Past accuracy of the rainfall outlook this time of year is 65-75%.
May is forecast to be drier than average.
Rainfall – The chance of above median for May to July

Source: Bureau.
Temperature
The Bureau’s temperature outlook for May to July is for the warmer weather to continue with an increased chance of unusually high daytime and overnight temperatures across most of Australia.
The chance of above median maximum temperature for May to July

Source: Bureau.
18. CLIMATE DRIVERS
Sea surface temperatures around most of Australia remain warmer than average and provide a potential moisture source if weather events can link up and carry the moisture to our part of the continent.
ENSO remains neutral, and global models currently predict neither El Nino or La Nina until at least September.
The Indian Ocean Dipole remains neutral.
Source: Bureau 15 April update.
19. CATCHMENT SOIL MOISTURE
The Bureau graphs below show that modelled rootzone soil moisture (top 1m) in the upper-Murray and Goulburn catchment is drier for this time of year.
Rootzone soil moisture, upper-Murray (%)

Source: Bureau.
Rootzone soil moisture, Goulburn catchment (%)

Source: Bureau.
Rootzone soil moisture levels in other valleys can be viewed at the Bureau’s Australian Water Outlook.
20. CARRYOVER VOLUMES INTO 2024-25

Source: NVRM. NSW DCCEEW.
————————————————————————————————————————————————————————————————————
21. USEFUL WEB SITES – for more information related to upcoming irrigation water availability
Rainfall
Recent rainfall. Map. Rainfall for the past day, week or months. BoM.
Recent rainfall. Map. Australian weather stations. Daily, weekly, monthly rainfall all years. BoM.
Recent rainfall. For select Victorian locations. Past 7 days. BoM.
Recent rainfall. Rainfall in the last 24 hours, since 9am, or in last hour. BoM.
Rainfall since 9am. Updated every half hour. For select locations. Rainfall (temperaturre and wind) shown on map as coloured text. Click on “weather observations” (bottom right of screen). Double click on the weather station (location) on the map for more details. “Rain radar” web site. BoM.
Forecast rainfall. Map. For next 4-day or 8-day period, or for any particular day over the next 5 days. BoM.
Forecast rainfall. For nominated locations. 7-day outlook. Forecast rainfall (wind and temperature) given in 3-hour windows. “MetEye” web site. BoM.
Chance of at least. BoM
Chance of at least. Climate services for agriculture.
Windy. Top global climate models at your fingertips including ACCESS (Australian), ECMWF (European), GFS (US), and ICON (German). Provides forecasts out to 14 days for rain, temperature, wind and other weather variables.
MDBA Weekly River Murray Report. Provides a weekly review of rainfall and lots of other important updates for the connected southern MDB.
Streamflow response and inflows
Murray system. MDBA Weekly Report. Inflow graphs are at the back of the report. Compares recent inflows with long-term averages. Weekly streamflow response commentary is also provided at the front of the report.
Murray system. Click on a site (eg.Hinnomunjie or Jingellic) and select the “Flow” tab. Updated daily. MDBA.
Goulburn system. Doherty’s, Jamieson, Gerrans Bridge and Glen Esk are some monitoring sites above Lake Eildon. Updated daily. GMW.
Goulburn Murray storage inflow data. Graphs of relative monthly inflows. Analysis of monthly and year-to-date inflows. NVRM.
Campaspe, Broken, Loddon, Ovens and Kiewa Basins. Updated through the day. GMW.
River flood condition. Current. Graphs of recent river height relative to minor, moderate and major flood levels. BoM.
Flood class level. Shows minor, moderate and major flood levels for different monitoring sites. BoM.
Annual streamflow differences and streamflow data. For many Australian locations (“Hydrological Reference Stations”.) Daily, monthly and annual streamflow data and analysis. BoM.
Water data online. Shows flow data (often measured as cubic metres per second “cumec”!) and useful analysis including monthly mean flows for hydrologic reference stations around Australia. BoM.
Surface water monitoring sites. Vic. Stream level. Streamflow data and reports. DELWP.
Streamflow – NSW. Shows current, historical and forecast flow rates and river levels for NSW river gauges. (Select a location on the map and choose the “gauges” tab.) Water Insights. WaterNSW.
Past, current, forecast and projected run-off maps. Forecast – for each of next 3 months. Projected – 2030, 2050, 2070 and 2085. BoM – AWO.
Past, current, forecast and projected evapotranspiration maps. Forecast – for each of next 3 months. Projected – 2030, 2050, 2070 and 2085. BoM – AWO.
Streamflow forecasts
Seasonal streamflow forecast. Up to 3-month forecast. eg. Forecast inflows for Lakes Hume, Dartmouth, Eildon, Eppalock or Nillahcootie. BoM.
7-day streamflow forecast. eg. For locations in the upper-Murray, upper-Goulburn, Campaspe or Loddon. BoM.
Murray system. Click on a site (eg. Hinnomunjie or Jingelic) and select the “Flow Forecast” tab. 7-day forecast. MDBA.
Catchment condition
Current relative long-term rootzone soil moisture. Map and graph. eg. Type “Upper Murray River,” “Goulburn River” or “Broken River” into the Search Bar. BoM.
Historical, forecast and projected soil moisture. Forecast – for each of next 3 months. Projected – 2030, 2050, 2070 and 2085. BoM – AWO.
Seasonal water determinations
Current Northern Vic allocations. Current allocations for the different Northern Victorian irrigation systems. NVRM.
Historical Northern Vic allocations. Historical allocations data for the different Northern Victorian irrigation systems, back to 1994-95. NVRM.
Current and historical NSW allocations. Water Alloction Statements, iIncluding NSW Murray and Murrumbidgee. DPIE.
Current and historical SA allocations. Water Allocation Statements and pre-season announcements. DEW.
MDBA Weekly River Murray Update. Summary of current water allocations for different vallies in the sMDB, usually on the last page of the report.
Water allocation outlooks
Northern Vic. Current outlook for the different Northern Vic irrigation systems. NVRM
NSW. Includes NSW Murray and Murrumbidgee. The water outlook is included in the relevant Water Allocation Statements, usually on the back page of the report. DPIE.
Northern Vic Water Balance (“rocket”) diagrams. Graph showing a breakdown of the water in store and water commitments, for each Northern Vic irrigation district. NVRM.
Climate outlook
Climate outlook. Weeks, months and seasons. The one-week and two-week forecast maps and graphs are updated daily. Forecasts for months and seasons ahead are updated every Thursday. BoM.
Climate Driver Update. Over-all summary. Pacific Ocean. Indian Ocean. Southern Ocean. Sea surface. Issued fortnightly. BoM.
Outlook scenario for rainfall amount. Map showing chance of rainfall amount for next week, fortnight, month or 3-month period. BoM.
Chance of at least (rainfall). Map showing probabilities of receiving a specified amount of rain for next week, fortnight, month or 3-month period. BoM.
The Fast Break. A farmer-oriented update of seasonal climate drivers and outlooks, including a summary of rainfall predictions for the next 3 months from 12 different climate models. AgVic.
Climate driver tool. Interactive tool that enables you to explore how rainfall at your selected location has been influenced by different climate driver phases, in the past. The tool also provides analysis of long-term rainfall records. AgVic, GRDC and SARDI.
My Climate View. Designed to help Australian farmers better understand the climate risks and opportunities facing them over the next 50 years. BoM and CSIRO.
Weather warnings
Victorian warnings. Summary of valid weather warnings issued, including floods. BoM.
River Height and flood class. Provides data on current river height, flood class and whether rising, falling or steady. Table and graphs. BoM.
Streamflow flooding and recent rainfall. Shows river condition (flooding) for monitoring sites across catchments. Map. BoM.
Water storage
MDBA River Murray Weekly Report (produced on Fridays):
– Graph showing ‘MDB Active Storage’, recent and over the last 20 years. This graph only appears monthly, usually in the first week of the month
– A summary of storage volumes and weekly volume changes for southern MDB storages are given in tables (usually on about page 3).
Northern Vic Resource Manager. Provides a breakdown of volumes currently available in allocation accounts, new allocation volumes in the current season, volumes carried over into the season, volumes in spillable accounts and net trade – for each irrigation district and for private, environmental and Water Corp holdings.
Goulburn Murray storages. Shows current storage levels, weekly change and storage at the same time last year, for Murray, Goulburn, Ovens, Broken, Campaspe, Loddon and Bullarook storages. Graphs of storage levels this year, compared to previous years are shown. Updated regularly. GMW web site.
Goulburn Murray storages. Shows storage level graphs and data for Murray, Goulburn, Ovens, Broken, Campaspe, Loddon, Kiewa and Bullarook storages. Updated every 15 minutes. GMW.
Goulburn Murray storages. Shows graphs and data for observed volume, level and percentage full for GM storages. (Select ‘System Status Report’, choose which ‘Basin’, select ‘Storage’, then select your storage.) GMW.
Murray storages. Click on the storage (eg. Hume Dam) to get ‘percent full’ and current storage volumes. This site is regularly updated. MDBA.
Murray Darling Basin storages. Shows ‘percent full’ figures for storages in the Basin. Also provides ‘percent full’ for ‘Southern Basin total.’ Updated fortnightly. The fortnightly MD Basin Storage Report featuring a map with current MDB storage volumes, can be downloaded from this page. MDBA.
Murray Darling Basin storages. Shows dam volume and ‘percent full’ figures for Basin storages, different systems (eg. Murray and Goulburn) compared to last year, and a break-down of how the water is shared (eg. private, environment, water corporation). Updated regularly. BoM.
NSW storages. Provides “percent full”, current volume, inflow and release data for NSW storages. Updated regularly. (Select a location and the “storage” tab. Water Insights – WaterNSW.
Archived Basin storage reports. Provides an archive of fortnightly reports showing MDB water in storages, back to 2009. MDBA.
Carryover volumes
Northern Vic Resource Manager. Shows carryover volumes for each (Northern Vic) irrigation district.
NSW. Carryover percentages for NSW Murray and Murrumbidgee systems are usually included in the Water Allocation Statements (usually in a table on page 1). DPIE.
- SA. Developments regarding SA carryover and whether or not it is available in an irrigation season, are typically found in the pre-season announcements. DEW.
Vic Carryover Tool. To help you work through carryover scenarios for your unique Vic farm situation. DELWP (Vic Water Register).
Water availability
Unused water – Vic. Shows volume of carryover, allocation, use, net trade, write-off and a graph of unused available water in recent seasons for each northern Vic valley. Vic Water Register.
Available water by owner type – Vic. Shows carryover, allocation, trade and spill volumes for Vic valleys. Private, environment and Water Corp ownership categories. Current and previous years. Scroll down for Further Insights. Vic Water Register.
Water allocated and used – NSW. Shows the volume of water allocated and used against entitlement type and ownership class. This information is shown for the current year or previous years. (Select a location and click on the “allocation” or the “historical” tab.) Water Insights. WaterNSW.
Usage dashboard, NSW. Shows historical water usage across different regions within NSW, by water source, licence category and river section. Water NSW.
River Murray flow and use in SA. Shows river flow into SA and a break-down of water use. Updated quraterly. SA Dept of Env and Water.
River Murray Water Calculator – SA. Shows SA allocation and entitlement volumes for different water classes under different water availability scenarios. SA Dept of Env and Water.
Southern Basin water availability. Shows the current sMDB water volume compared to the same time last year, for the past 10 years, and since 1979. Gold!! BoM MDB Water Information Portal.
District water use and trade – Northern Vic
District Water Use. Water used in different Northen Victorian irrigation districts by private, environment and water corp owners. NVRM web site.
Net Trade for Districts. Trade in and trade out, for different Northen Victorian irrigation districts by private, environment and water corp owners. NVRM web site
Water available by owner type. Vic district carryover, allocation, trade and spill volumes. Vic Water Register.
Risk of spill announcements
Northern Victorian Resource Manager. Sometimes the Vic risk of spill information is included in the Seasonal Outlook announcements.
Current state shares in Murray storages
MDBA Storages. Displays the shares of the MDBA “Active Storages” (Lakes Hume, Dartmouth, Menindee and Victoria) for Vic, NSW and SA. This site also shows the relative “air space” for each share (Vic, NSW & SA). Scroll to the bottom of the page and click on the PDF for the latest update. MDBA.
Intervalley trade (IVT)
Goulburn IVT
Opportunity for allocation trade. Interactive tool. Vic Water Register web site.
Planned monthly IVT transfers. Scroll down to the heading “Planned Inter-Valley Trade Transfers.” GMW web site.
Goulburn to Murray trade rules. Be carefull to stay informed about the latest changes to Goulburn to Murray trade rules. Vic Water Register web site.
Barmah Choke
Barmah Choke trade balance. Current and historic trade balance data. MDBA web site.
Allocation trade opportunity. Interactive tool. Vic Water Register web site.
Murrumbidgee IVT
IVT Status. Provides the current Murrumbidgee IVT Account Balance, whether trade is open or closed and backgound information. WaterNSW site.
Annual plan for MDB IVT
MDBA River Murray System Annual Operating Outlooks. Outlines potential forward scenarios of IVT delivery for the irrigation season ahead – which can be useful if you want to gain a better understanding of how much water may be traded out of different valleys in the remainder of the season.
Water Market Outlook
ABARES Dashboard. Water Market Outlook for sMDB water allocation prices for wet, average and dry scenarios. Water market reports are also provided.
Water market information
Weekly Water Market Report. H2OX.
Weekly Newsletter. Ruralco.
Weekly Water Report. Waterfind.
Weekly Water Wrap. Waterpool.
Water reports. Aither.
Weekly Australian Climate, Water and Ag Update. ABARES
Aggregated MDB water listings – “WaterFlow.” Marsden Jacobs and Australian government.
WaterExchange. Water market and clearing house.
Water market summary dashboard. BoM
Vic water register. DEECA.
—————————————————————————-
This publication is provided solely for information purposes and no representation or warranty is made as to its quality, accuracy, completeness, suitability or fitness for any particular purpose. You should make your own inquiries as to its appropriateness and suitability for your particular circumstances. The State of Victoria as represented by its Department of Energy, Environment and Climate Action accepts no duty of care and disclaims all liability in relation to use of this publication.
Information in these updates is provided to assist irrigators make more informed and earlier farm management decisions related to upcoming irrigation water availability. The information is NOT intended to assist with financial decision making related to water investment or water trade.
Due to a need for the release of timely information, this report is not subject to rigorous checking and approval procedures. Figures provided in this report are entered manually and are subject to error. Information in this report needs to be checked with other sources.
—————————————————————————-