In Queensland Daniel Nicoletti started the season with the orchard suffering from the effects of long-term drought and facing the driest year on record. Mites and mealybugs had become major problems in recent years possibly as a result of the codling moth control program impacting on predatory mites and ladybird beetles. The hot dry weather continued with 33 days of maximum temperatures over 30 degrees in December and January, but rain eventually arrived with heavy falls in mid-January through to mid-February.
Daniel has one of the local agronomists do his pest monitoring and only one of the seven monitored blocks had codling moth recorded in traps. Damage recorded at harvest for that block from codling moth was 2% and 4.2% from mealybug, a reasonable result given the carryover pest pressure from the previous season and the weather conditions in 2019-20.
The mite population monitoring results provided by Daniel’s agronomist are presented in Table 1 as %leaves infested. Those data have been converted to cumulative leaf infested days (CLIDs) for presentation in the right hand column because damage by mites is a product of %leaves infested and the number of days they are infested. The CLIDs graph (Figure 1) suggests that there may be a problem developing in block 1 where the miticide applications had little effect on the slope of the curve.
Table 1: Data collected from Block 1 and 2 showing % leaves infested and Cumulative Leaf Infested Days (CLIDs)
| Block | Date | % TSM on leaves | CLIDs |
| 1 | 18/10/2019 | 2 | 2 |
| 1 | 28/10/2019 | 8 | 52 |
| 1 | 6/11/2019 | 2 | 97 |
| 1 | 21/11/2019 | 14 | 217 |
| 1 | 2/12/2019 | 28 | 448 |
| 1 | 19/12/2019 | 60 | 1196 |
| 1 | 6/01/2020 | 40 | 2096 |
| 1 | 16/01/2020 | 18 | 2386 |
| 1 | 31/01/2020 | 27 | 2723.5 |
| 1 | 17/02/2020 | 46 | 3344 |
| 1 | 26/02/2020 | 47 | 3762.5 |
| 1 | 10/03/2020 | 30 | 4263 |
| 1 | 27/03/2020 | 18 | 4671 |
| 1 | 7/04/2020 | 0 | 4770 |
| 1 | 23/04/2020 | 3 | 4794 |
| Block | Date | % TSM on leaves | CLIDs |
| 2 | 18/10/2019 | 0 | 0 |
| 2 | 28/10/2019 | 0 | 0 |
| 2 | 6/11/2019 | 3 | 13.5 |
| 2 | 21/11/2019 | 6 | 81 |
| 2 | 2/12/2019 | 5 | 141.5 |
| 2 | 19/12/2019 | 54 | 643 |
| 2 | 6/01/2020 | 51 | 1588 |
| 2 | 16/01/2020 | 21 | 1948 |
| 2 | 31/01/2020 | 6 | 2150.5 |
| 2 | 17/02/2020 | 18 | 2354.5 |
| 2 | 26/02/2020 | 12 | 2489.5 |
| 2 | 10/03/2020 | 5 | 2600 |
| 2 | 27/03/2020 | 10 | 2727.5 |
| 2 | 7/04/2020 | 0 | 2782.5 |
| 2 | 23/04/2020 | 0 | 2782.5 |
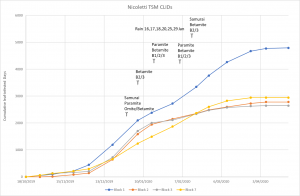
Figure 1 – Cumulative Leaf Infested Days (CLIDs) graph showing a possible problem in Block 1
CLIDs was first developed for use in WBC pears which are highly sensitive to mite damage. Since then we have also used CLIDs in Packham pears and apples. The thresholds we use are 1500 CLIDs for WBC; 3000 CLIDs for Packhams; and >50000 CLIDs for apples. These thresholds are the maximum for the season, rather than for instantaneous readings, and the cumulative presentation of the results allows the grower to read the slope and estimate how quickly the threshold will be reached if no intervention is applied. In Daniel’s case he was able to keep even his worse block below the threshold of 5000 CLIDs and should not see any reduction in yield due to mite feeding.
For further information on CLID’s see our article: How to Calculate Cumulative Leaf Infested Days (CLID’s)
and our three videos on Mite Management
To see more Case Study Updates click here