To calculate Cumulative Leaf Infested Days (CLIDs) you need to first monitor weekly or fortnightly using the 10 leaves / tree method and calculate the % of Infested Leaves (click here to download a template Monitoring Sheet).
Here is an example of how to calculate the % of infested leaves:
- Sample 5 trees
- From each tree look at 10 leaves with a hand lens
- Write down how many leaves out of the 10 have mites present (not how many mites are on the leaf)
- Add up how many of the 50 leaves have mites present to give you a ‘Total’
- Multiply the ‘Total’ by 2 to equal % infested leaves
| Date: 10/1/18 | Grower/Business: | Property/ Block: | |||||||
| Sample type | Pest/ Disease | Sample Tree | |||||||
| 1 | 2 | 3 | 4 | 5 | Total | ||||
| 10 leaves/tree | MITES | Total x 2= % infested leaves | |||||||
| leaves infested with European Red Mite
|
1 | 2 | 0 | 3 | 2 | 8 | 16 | ||
Next time you monitor for mites and you have calculated the % of Infested Leaves for that date, you can use this information to calculate the leaf-infested days between the two sample dates:
Leaf-infested days = average % leaves infested between samples x number of days between samples
To calculate the average % leaves infested between samples you simply add the % leaves infested on the 2 dates and then divide the result by 2. You then multiple that number by the number of days between samples to get the leaf-infested days (LIDs).
| LIDs = | (% leaves infested last week + % leaves infested this week)
2 |
x Number days between samples |
It is preferable to start monitoring before you see any mite damage. This is because the calculation to convert LIDs to Cumulative Leaf Infested Days (CLIDs) needs a starting point that is the last sample date before you started to record mites on leaves. An example is given below:
Here is an example to calculate the Cumulative Leaf Infested Days (CLIDs)
| Date | % Leaves infested (LI) | No of days between samples | Leaf Infested Days | Cumulative (running total) Leaf Infested Days (CLID) |
| 20/12/17 | 0 | 7 | 0 | 0 |
| 27/12/17 | 2 | 7 | (0+2)/2 x7 =7 | 0+7 =7 |
| 3/01/18 | 8 | 7 | (2+8)/2 x7 = 35 | 7+35 = 42 |
| 10/01/18 | 16 (8 leaves) | 7 | (8+16)/2 x7 = 84 | 42 + 84 = 126 |
These units are calculated for each leaf sample and a running total kept for the season (for the above figures it would be 7 + 35 + 84 = 126 CLID).
Understanding how to use the CLID figure
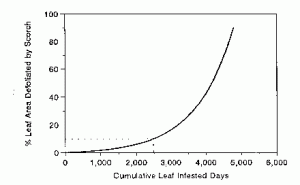
The CLID figure is an excellent guide to the mite pressure experienced by trees in a block. Leaf scorch develops when certain CLID levels are exceeded. The graph below shows the relationship between CLID and the level of leaf scorch that develops.

Figure 1. Relationship between ‘CLID’ and leaf scorch development. At 2400 CLID (dotted line) approximately 10% of the leaf area will be damaged by leaf scorch
Agriculture Victoria research used this relationship to develop damage thresholds. These will indicate when leaf scorch damage will develop before it actually occurs and allow appropriate control to be utilised only if necessary.
- 1% leaf scorch* will develop at approximately 1000 CLID
- 5% leaf scorch will develop at approximately 1500 CLID
- 10% leaf scorch will develop at approximately 2400 CLID
- 20% leaf scorch will develop at approximately 3000 CLID
These CLID levels are damage thresholds, i.e. they give an infestation pressure at which a known amount of leaf scorch will develop. We can also put an approximate cost on the damage levels shown above.
*Remember that the % leaf scorch damage figure is averaged over the whole block and, for example at 5% damage, some individual trees may have significantly higher levels of damage and others lower or nil damage.
Agriculture Victoria research also determined the threshold value, above which some yield losses would occur, for different types of fruit:
- For WBC pears the threshold value was around 1500 CLIDs;
- For Packham pears the threshold was around 2000 CLIDs;
- And most apples had thresholds greater than 2500 CLIDs.
This allows for quicker, more cost-effective monitoring of mite populations by using simple presence/absence assessments of leaves, and the graphical output allows growers and consultants to use the trend line to predict when the mite population would exceed the threshold well in advance of the event.
Further Information
For a more comprehensive explanation of mites, monitoring and calculating the thresholds and when to spray see Agriculture Victoria AgNote ‘Integrated control of Twospotted Mite in Orchards (AG0157) http://agriculture.vic.gov.au/agriculture/pests-diseases-and-weeds/pest-insects-and-mites/two-spotted-mite/integrated-control-of-twospotted-mite-in-orchards
Also see our series of three videos presented by David Williams on how to identify, monitor, and control mites: https://extensionaus.com.au/ozapplepearipdm/mite-management-in-orchards/ and our article on Mite Monitoring: key to sustainable chemical use.
