Agriculture Victoria has analysed data from 680 on-farm energy assessments and 320 grants to create a unique summary of Victoria’s on-farm energy use and improvements. This is a very large sample from approximately 1,300 free on-farm energy assessments and 650 grants provided under Victoria’s Agriculture Energy Investment Plan (AEIP Program) from 2018-2021.
The analysis shows the strong interest that agricultural businesses had in improving their on-farm energy efficiency and incorporating renewable energy into their agriculture operations.
Dairy farmers were particularly interested in the AEIP Program with the highest number of farm businesses receiving on-farm energy assessments and approved grants. While dairy farmers were the largest group of participants in the AEIP Program, horticulture growers showed the greatest potential for energy savings, especially from upgrading irrigation systems and cool rooms. The types of energy used on farms differed across each sector, with horticulture using the most natural gas and pig and poultry farms used the most LPG. Cropping, meat, and wool had the highest diesel-related energy costs.
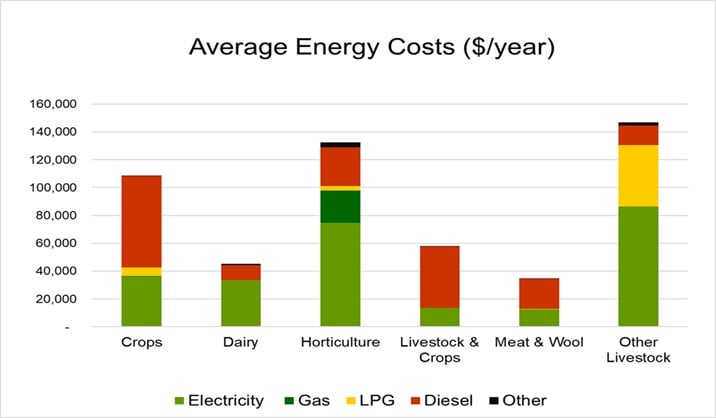
Average costs per energy source each year for each agricultural industry.
Solar energy generation was the most adopted form of on-farm renewable energy. Installing variable speed drives and upgrading to more energy-efficient equipment were popular energy improvements.
Interestingly, the cropping, meat and wool sectors had the highest rate of implementing recommendations from the on-farm energy assessments, while having relatively low numbers of assessments compared with dairy and horticulture.
The co-benefits from those actions adopted was calculated. A simple payback highlighted the co-benefits (including reducing water, labour and chemical use, product quality, animal welfare, and productivity gains among others) for the different production types.
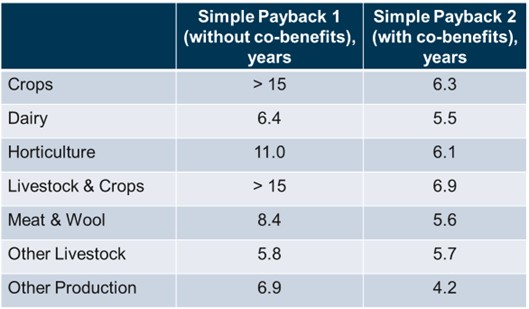
Simple payback, with and without co-benefits, and average energy savings for 320 grant holders for each industry.
The analysis showed that the 320 energy grants represented almost $43 million invested in energy upgrades and over 27,000 tonnes of greenhouse gas emissions (CO2 equivalent) savings per year. However, the total from the AEIP Program is greater than this.
Download a copy of the full report – Agriculture Energy Investment Plan: Analyses of ‘Round 1’ farm energy assessments and grants