As part of the Accelerating Change project in Northern Victoria, various soil moisture monitoring (SMM) devices were used over the last 3 years under surface irrigated pasture and other forages on farm to assist with improved irrigation timing.
Key learnings
SMM provides objective and useful information for irrigation scheduling and reduces the guesswork involved.
Remote screen-read SMM systems can also reduce the labour required to assess when irrigation timing is optimal.
SMM can be of most value when a new crop is grown and in autumn and spring when water requirements tend to be most variable.
“I find the soil moisture devices are of particular value for the first and last irrigations of the season and also to see what affect rainfall has had on moisture levels.” Farmer.
Like any other irrigation scheduling tool, SMM needs to be used in conjunction with other scheduling methods already used on the farm, not in isolation. Ideally SMM is used along with evapotranspiration (ETo) information. SMM can be a very useful learning tool and can result in improved water productivity over the season.
“We use soil moisture monitoring as a guide for irrigating our farm.” Farmer.
Care needs to be taken to select a representative area of the farm to install the SMM equipment. Care also needs to be taken to install the equipment correctly and to interpret the moisture data correctly. Ongoing support, coaching and back-up service can be an important part of successful use of these tools.
“We’ve got good feed off our irrigation bays this year and a lot of it is due to good irrigation decisions.” Farmer.
Types of soil moisture monitoring systems
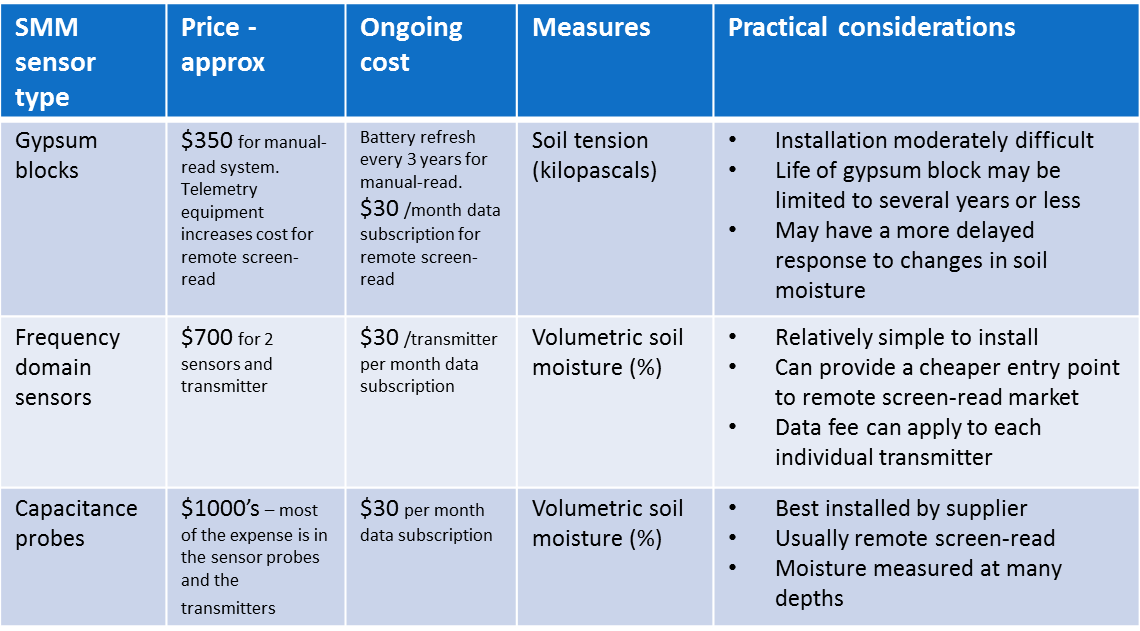
Different types of SMM sensors and telemetry systems were used in the Accelerating Change project. The table below shows the different systems used, the associated cost, and practical considerations for each system.

Table 1: Soil moisture monitoring systems used in the Accelerating Change project
Frequency domain sensor system
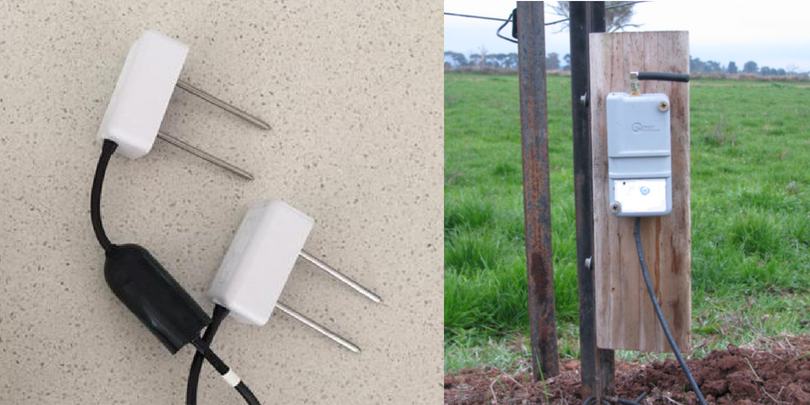
Last irrigation season (2017-18) a remote screen-read, frequency domain sensor system was used under surface irrigated, shallow rooted perennial pasture. This system was introduced because it is on the cheaper end of the market for remote screen-read systems.

Figure 1: Frequency domain sensors (left) and associated transmission unit, mounted on a star post (right)
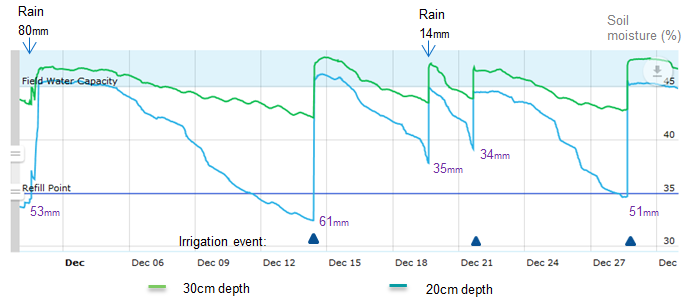
A screenshot of soil moisture readings measured by the frequency domain system for 20cm and 30cm soil depths is shown in the graph below. Rainfall (top of graph) and irrigation events (triangles) have been added by the author along with ‘cumulative evapotranspiration minus rainfall’ (ETo-R; purple figures).
The graph demonstrates the valuable soil moisture information that can be used for irrigation scheduling decisions. The characteristic saw-tooth pattern created by the soil wetting and drying cycle is evident at both 20cm and 30cm depths in the soil profile.
It can be seen that the irrigation event on 14 December was later than ideal. This is indicated by the 20cm trace (blue line) moving below “Refill point” (horizontal line). Also when this irrigation occurred (14 December), cumulative ETo-R since the last irrigation reached 60mm, which is beyond the ideal ETo-R of 40mm to 50mm for this situation.
The “Refill point” line represents an arbitrary value that has been determined and refined over time based on measurements of soil moisture, cumulative ‘ETo-R’ between irrigations and irrigator experience on the farm.
It can also be seen in the graph that irrigation occurred earlier than optimal on 21st December, but was well timed on 28th December. Both rainfall events (2nd and 19th December) increased soil moisture at 20cm and 30cm depths.

Figure 2: Soil moisture measured by frequency domain sensors under surface irrigated pasture
Content sources and further information
What to know about soil moisture monitoring
Dairy Australia Soil Moisture Monitoring fact sheet
Rob O’Connor, Agriculture Victoria Echuca, (03) 5482 1922

