The Back of the Envelope Risk Analysis (BOERA) developed by Queensland Department of Agriculture and Fisheries enables you to test your crop management options using likely crop performance, potential impact of constraints and the likely economic returns.
Farm management decisions often involve many choices, including do-nothing. For many on-farm decisions it is important to only consider the things that change with the decision (partial analysis) which include the likely outcome (risk). The BOERA economic framework enables you to test your crop management options using likely crop performance, impact of constraints and possible economic outcomes. The framework allows you to test and compare likely net income, probable best option and return on investment to guide management decisions.
Consider Alex, a farmer who has identified broadleaf weeds in a newly sown wheat crop. The wheat crop yield without weed damage is likely to be between 1.5 and 4 t/ha, with an expected price of $200/t (Figure 1). The reduction in yield from the weed infestation is likely to be between 25% and 60%. After speaking with an agronomist, there are 2 viable treatment options. While ‘herbicide A’ is a considerably cheaper alternative to ‘herbicide B’, it is also less effective than ‘herbicide B’. Alex compares the treatment options, including ‘no control’, by entering this information into the BOERA, and then clicks calculate.
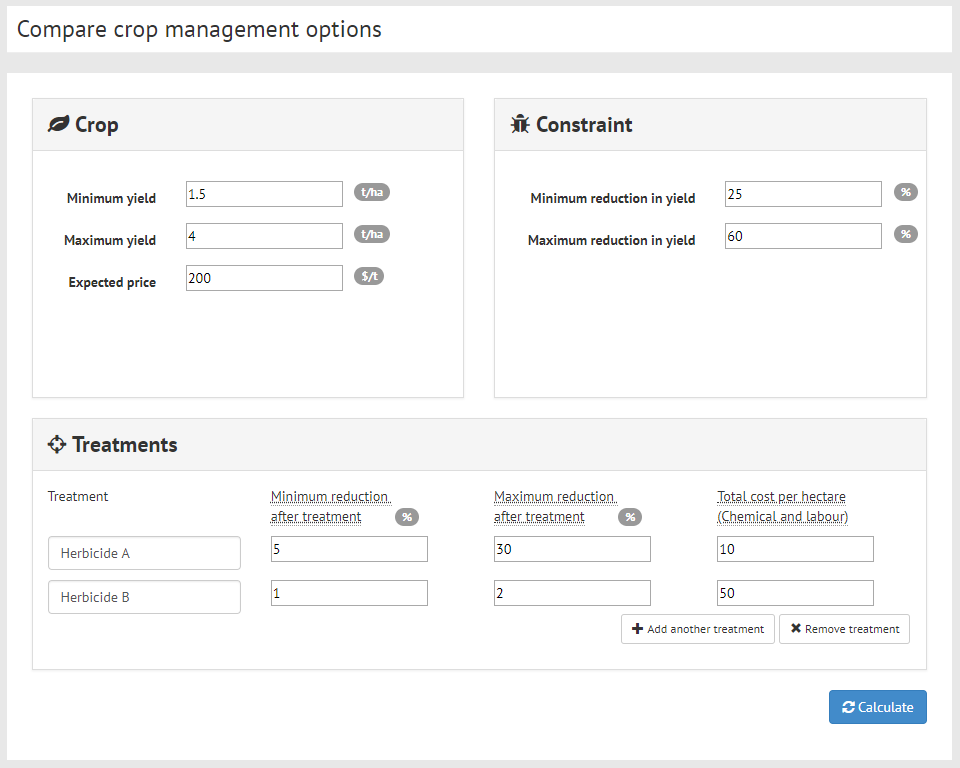
Figure 1: Crop management options, showing initial assumptions for ‘Scenario 1 – Alex’
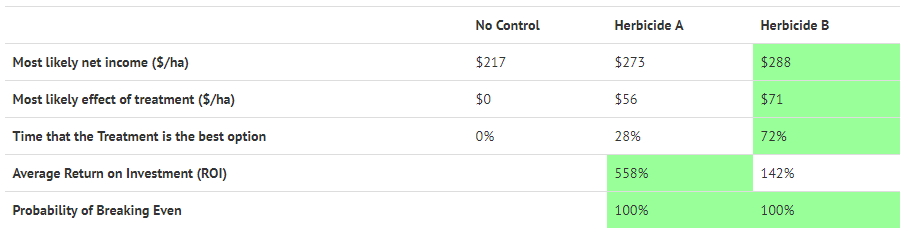
As shown in table 1 below, when comparing the two treatment options to the ‘no control’ option, the ‘most likely effect of treatment’ with ‘herbicide A’ is $56/ha, compared to ‘herbicide B’ having a $71/ha return above the most likely net income of ‘no control’. The ‘time that the treatment is the best option’ shows that herbicide B is likely to be the best option 72% of the time.
However, table 1 also shows that ‘herbicide A’ offers the highest ‘return on investment’, as it has similar net benefits but with a lower investment cost. When the ‘most likely effect of the treatment’ is compared to the total cost of ‘herbicide A’ which was input into the calculator in Figure 1 (i.e. $56/ha / $10/ha = 560% rounded), the considerably cheaper option offers a greater ‘return on investment’. This indicates that for every dollar Alex spends on the ‘herbicide A’ treatment option, $5.60 will be earned.
Table 1: Likely effects on income and ROI of two treatments applied in Scenario 1.
In Figure 2 below, the possible net incomes are shown by the curves, being the cumulative distribution function (CDF). One way to interpret this type of chart is to view the median value, effectively the midpoint (p = 0.5 on the vertical y-axis) as the expected net income. If you were to do the same experiment many times, the median is the point in the middle of the observed results. There is a 50-50 chance of the results falling above or below the median. The worst-case scenario is when p = 0, and the best-case is when p = 1.
For Alex, the CDF shows that the expected or median (p = 0.50) net income for ‘no-control’ will be $217/ha, ‘herbicide A’ will be $273/ha, and ‘herbicide B’ will be $288/ha. (where the curve hits the midpoint). The ‘most likely effect of the treatment’ (from Table 1) is the difference in net income between ‘no-control’ and the treatment options.
The CDF also shows that ‘herbicide A’ and ‘herbicide B’ will always have greater net incomes than ‘no control’. The time when ‘herbicide B’ will have greater net income than ‘herbicide A’ is shown when the orange ‘herbicide B’ curve is on the right. This occurs 72% of the time, indicating ‘herbicide B’ is the best choice 72% of the time. This can also be present as a pie chart, see Figure 3.
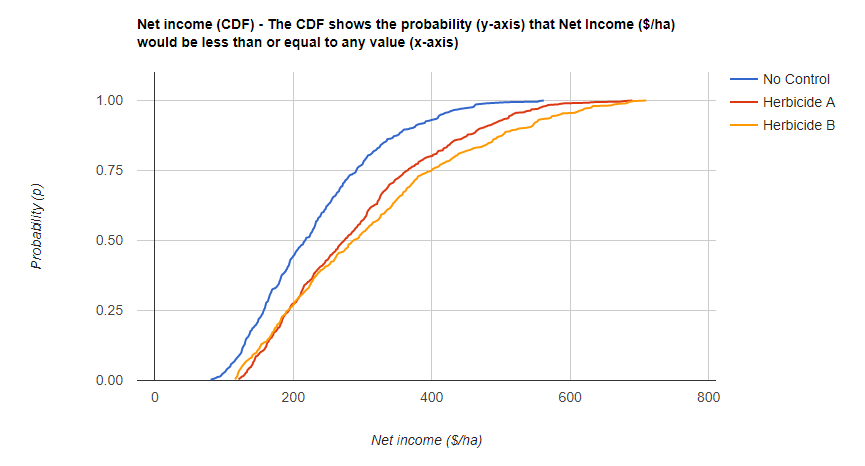
Figure 2: Net income CDF for multiple management options in scenario 1
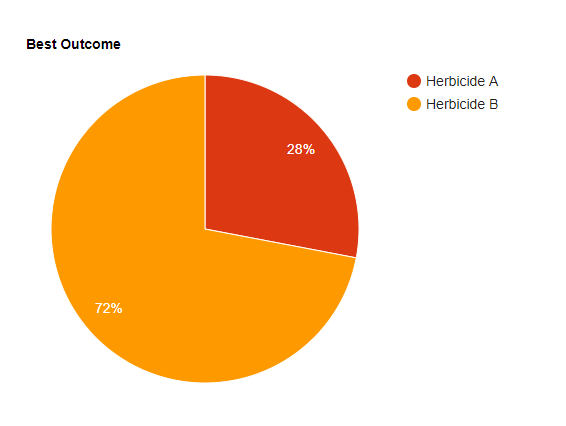
Figure 3: Pie chart showing likelihood of preferred outcomes from two management within Scenario 1.
Another way of presenting the same information is shown by the probability of exceedance (POE). This simply flips the graph, where the worst-case scenario is p = 1 and the best-case is p = 0. Which chart is used is based on past experiences and personal preferences.
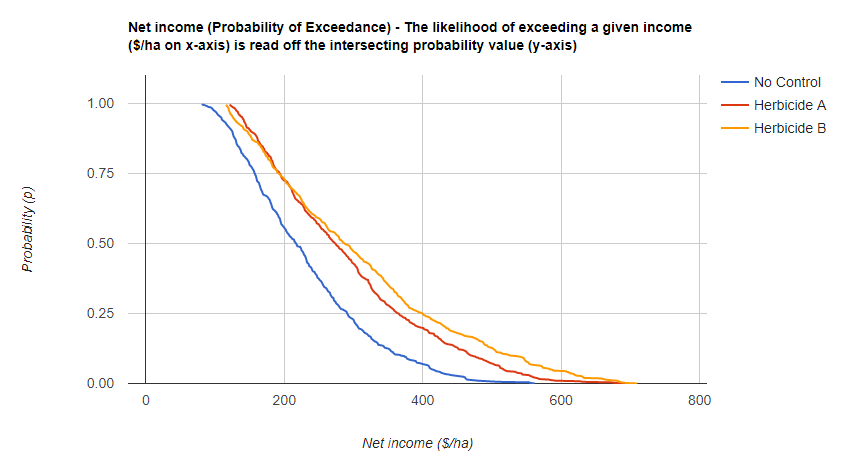
Figure 4: Net income (probability of exceedance) results from Scenario 1, showing similarity of outcomes for Herbicides A and B.
When Alex considers the best treatment option, it’s important to weigh up the most likely net income, probable best option and return on investment to guide management decisions. Considering the likely outcomes or the time when one treatment option is better than another incorporates risk in your decisions.
The best treatment option for any farmer is one that best meets their preferences (attitudes) for risk and business objectives.
Click here to start the calculator for yourself.
Acknowledgements
Andrew Zull (Queensland Government, Department of Agriculture and Fisheries)
Chris Carter (AEGIC (formerly Government of Western Australia, Department of Primary Industries and Regional Development))