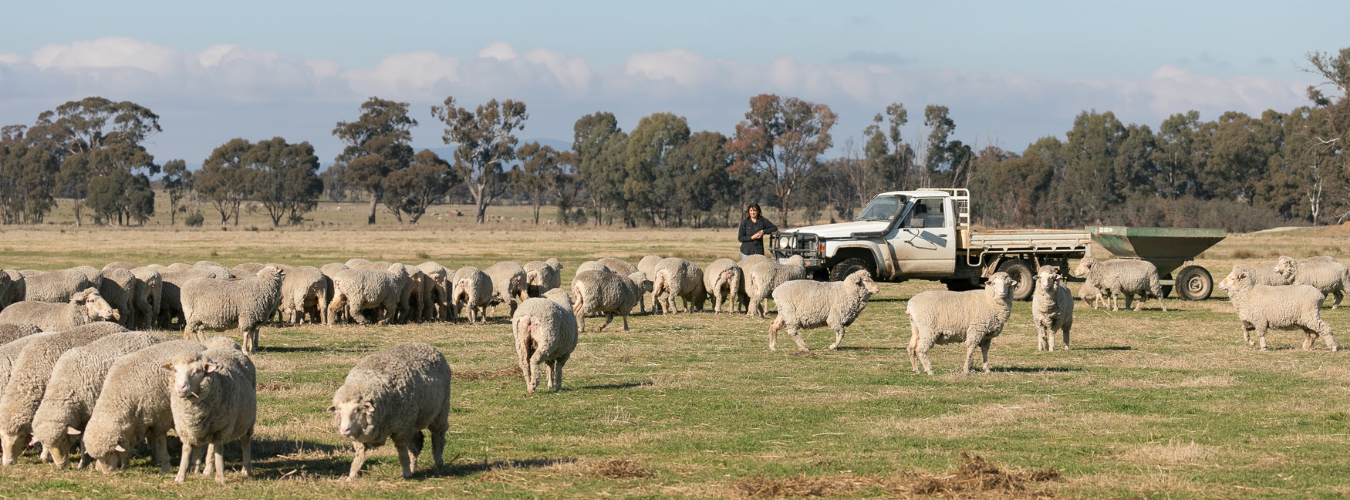
Agriculture Victoria’s latest Livestock Farm Monitor Project (LFMP) for 2017-18 assessed the economic performance of 77 sheep and cattle farms across Gippsland, the South-West, and Northern Victoria regions. The project has a 48-year history in Victoria reporting on characteristics of average and top performance among participant farms.
Case Study
The following farm from the South West was selected for further analysis due to consistently recording strong profits relative to their contemporaries, as ranked by return on assets (RoA) (Figure 1). A significant increase in RoA in the 2016-17 financial year also warranted further investigation. When a significant spike either way is identified, it is important to drill down and see what can be learned by all livestock producers.
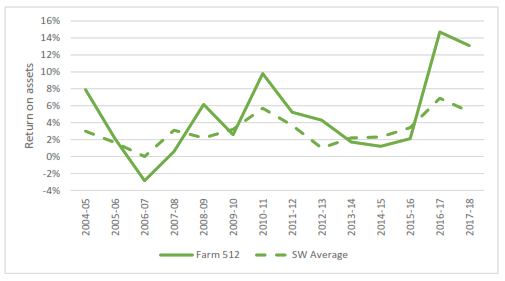
Figure 1 Return on assets 2004-2018. Source: Livestock Farm Monitor Project
While improved commodity prices coupled with seasonal conditions impacted on the individual enterprises and farm business economic performance, the significant on-farm parameter to focus on is the increase in greasy wool cut by 38% and the ability to produce more kilograms (kg) of lamb carcass weight (cwt) per hectare (ha). It is also important to note the change in enterprise mix between the 2015-16 and 2016-17 financial years.
The farmers’ ability to control variable and overhead costs, which decreased by 8% year-on-year (y/y), resulted in a 90% increase in net farm income between the 2015-16 and 2016-17 financial years. In 2017-18 the strong commodity prices compensated the 12% y/y increase in variable and overhead costs leading to a 5% increase in net farm income in the same period. Table 1 below shows the increase or decrease between 2015-16 and 2016-17 financial years and includes data from 2017-18.
Table 1 Farm Case Study review 2015-2018, Green = increase, Red = decrease. Source Livestock Farm Monitor Project
| 2015-16 | 2016-17 | Increase/decrease | 2017-18 | |
| Merino | ||||
| Enterprise Mix |
75% |
61% | ↓ |
61% |
| Wool cut (greasy) |
40.5kg/ha |
65.5kg/ha | ↑ 38% |
59.3kg/ha |
| Average Yield |
66% |
70% | ↑ |
69% |
| Average Micron |
17.5 |
17 | ↓ |
17 |
| Net price after futures & sell costs (greasy) |
$8.46 |
$11.10 | ↑ 24% |
$15.32 |
| Sale values per head (net) |
$81.16 |
$94.31 | ↑ 14% |
$132.82 |
| Lamb Marking % |
96% |
95% | ↓ |
87% |
| Prime Lamb | ||||
| Enterprise Mix |
25% |
39% | ↑ |
39% |
| Wool cut (greasy) |
49.5kg/ha |
38.5kg/ha | 22% ↓ |
47.6kgs |
| Average Yield |
68% |
69% | ↑ |
70% |
| Average Micron |
18.5 |
18 | ↓ |
18 |
| Net price after futures & sell costs (greasy) |
$7.86 |
$13.58 | ↑ 42% |
$13.69 |
| Sale values per head (net) |
$79.01 |
$104.49 | ↑ 25% |
$89.93 |
| Lamb Marking % |
90% |
84% | ↓ |
92% |
| Overall | ||||
| Gross Income |
$476,740 |
$803,316 | ↑ 40% |
$864,696 |
| EBIT |
$162,879 |
$513,963 | ↑ 68% |
$542,292 |
| Net farm income |
$38,239 |
$392,680 | ↑ 90% |
$411,261 |
The key drivers and on-farm decisions implemented which led to the significant improvement are:
- They have shifted their focus to wool, with prime lamb enterprise becoming a by-product. Change in enterprise mix to 61% merino and 39% prime lamb increased kg cwt/ha. This better aligns with what they enjoy.
- Shearing wethers instead of selling in wool; will normally shear merino wethers twice before selling increasing kg of wool cut
- Pulling back on cropping operation
- Timing of changes met favourable seasonal conditions and commodity prices
The on-farm parameters focused on by the farmers include:
- Increasing fertility of Merino enterprise over last 10-15 years, ram selection has been critical and staying with an enterprise they enjoy
- Increasing lamb marking percentages by focusing on pasture improvement, ewe nutrition and timing of lambing
- Spreading potash and using rotational grazing to ensure improved nutrition availability and ewe condition
- Improving pastures negates increased supplementary feeding costs
- Being prepared to be flexible with their management decisions e.g. destocking if dry spring forecast
- Nutrition for prime lamb enterprise, rotational grazing, pasture availability, limit supplementary feeding especially after lambing commences
- Shifted lambing by two weeks to ensure increased pasture availability and improved ewe condition, which has not impacted on turn off weights or timing of lamb sales
The farmers’ sales strategies include:
- Forward contracts for wool, record wool prices have impacted this, but overall a useful strategy in other years
- Lambs are sold via saleyards and direct to Coles
- Cull ewes direct to abattoirs
- Stock agent pivotal to sourcing contracts and advising on optimal time of sales
The above sales strategy and commodity prices received is market driven apart from some emphasis on wool price risk management with forward contracts offering the farmers comfort when wool price is volatile. This is a beneficial strategy when they have a large focus on wool.
Consideration towards forward contracts for a percentage of prime lamb production will lock in a price and manage risk should sustained prime lamb prices start to decline.
Sensitivity Analysis
A sensitivity analysis of decreases and increases in wool cut, price and sale values per head between 2015-2018 looked at variation in kg greasy wool produced and price received per head. This analysis can assist with budgeting, managing risk and making on-farm decisions.
The case study farm produced similar wool cuts each year, but price received impacted on returns. The sales strategy of forward contracts can help assist with controlling the variation of price received for a percentage of wool cut. The impact a $50 per head reduction in greasy wool return can have on economic performance is an area to focus on to limit the variability and price risk.
An analysis of the sales values per head for the case study farm has revealed less variation in the prime lamb prices received over the three-year period which is supported by the 5th consecutive year of record lamb prices. There is $30 per head more variation in merino sales values due to demand from the meat processors.
From a production perspective their ability to produce more kg of cwt per ha also contributed to their improved economic performance. Over the three-year period they increased production by 126kg cwt/ha or in terms of 2017-18 prices, $1,032/ha. Depending on price received there was variation during the period of $711/ha. If 2017-18 production levels received 2015-16 prices there would have been a difference of $127,500 in gross income. This highlights the impact the market can have on business performance and the importance of managing price risk where possible to reduce the variation in price received.
Summary
The case study reveals that focusing on your on-farm parameters and decision making can turn around your farm business economic performance in a short period of time. The farmers only tweaked their management slightly to have a huge impact on their performance. While the timing of their decisions benefited from seasonal conditions and strong commodity prices, their ability to be flexible and make changes to take advantage of changing markets and conditions should not be underestimated.
Further Information
For further information regarding the Livestock Farm Monitor project or the 2017-18 results visit the website.
You can also read our article on the LFMP results – 2017-18 Livestock Farm Monitor Project Data is Now Available