Human eyes can see colour in the visible spectrum of light, such as the colours of the rainbow (blue, green and red visible light bands). Multispectral sensors or cameras from drones, satellites or other aerial vehicles can see these colours as well as the bands of light in the broader spectrum (including near infrared (NIR) and short-wave infrared). These bands can be used to obtain an indication of plant health when used to calculate different vegetation indices. This article describes some common vegetation indices available commercially.
NDVI
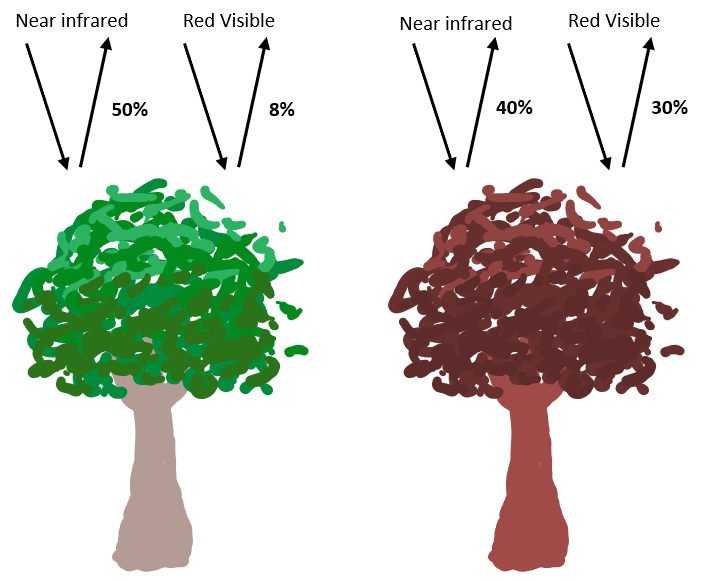
Normalised Difference Vegetation Index is the most readily known index, first introduced in the 1970s. It is mainly used as a measure of plant health and biomass. NDVI measures the density and condition of leaves in a vegetated area. Live, green vegetation absorbs visible red light in chlorophyll, and strongly reflects light in the near infrared (NIR). Unhealthy plants reflect more red light, resulting in a lower NDVI reading (image above).
NDVI is affected by the amount of ground cover, density, and greenness of vegetation. Vegetation which is more dense and greener will have a higher NDVI value. NDVI decreases as plants become stressed, diseased or die.
NDVI is strongly related to crop canopy cover and as transpiration is proportional to crop cover, NDVI can be used to determine a crop coefficient (Kc value). Kc can then be combined with weather data (ETo) to calculate estimated crop water requirements (ETc) using the equation:
Kc x ETo = ETc
IrriSAT is a free online platform which calculates Kc and subsequently ETc for a user-defined block using NDVI data from Sentinel-2 and Landsat satellites. More information about how to use IrriSAT can be found here.
One problem with NDVI when using it to measure vegetation density is that it saturates at high amounts of green biomass (dense canopies), resulting in the same NDVI reading for low and very high vegetation density. An alternative to overcome a dense canopy is the index NDRE.
NDRE
Normalised Difference Red Edge is considered a more sensitive approach to measure chlorophyll concentration. It is calculated using the same equation as NDVI except uses the red edge band reflectance instead of the red-light band. The red edge is a transition region between the limit of light absorption in the red spectrum and strong reflectance in the near-infrared. This makes it particularly sensitive to changes in vegetation health and nitrogen status.
By using red-edge reflectance, NDRE is more capable of capturing subtle variations in mid to late-season crops because the red-edge penetrates further into the crop canopy. This may be more useful in orchard management and the management of mature crops to help identify poor performance and subsequently diagnose the source of variability.
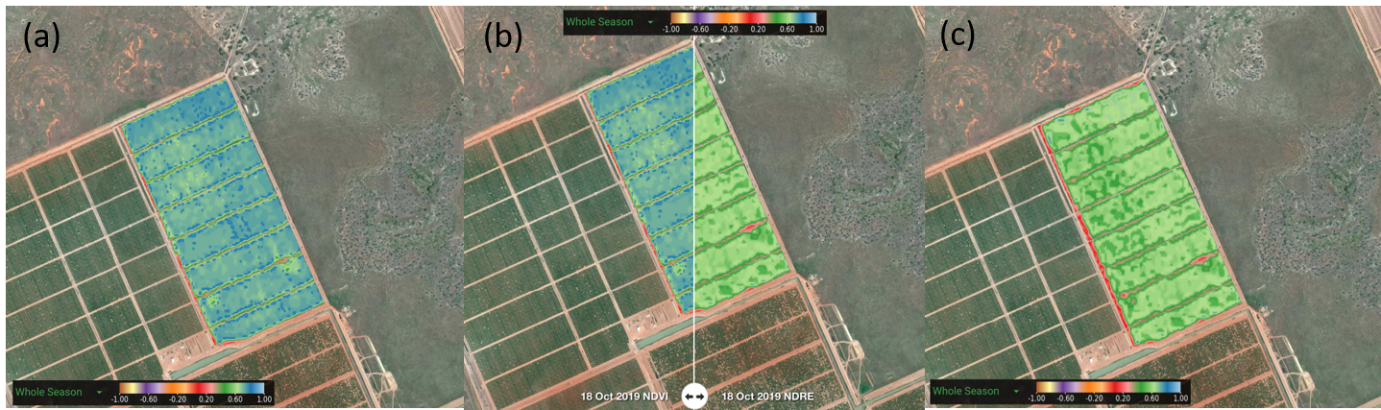
Figure 1. NDVI (a) and NDRE (c) captured in October for a patch of almonds. Note in NDVI (a) blue colour = 1 on a scale of -1 to 1. High biomass (canopy density) is causing saturation in the index. By using NDRE (c), the same patch comes up green (values 0.5-0.6 on a scale of -1 to 1), the index is not saturated and can therefore continue to capture variation in crop health under high biomass (Images courtesy of Marie Marion, FluroSat).
CCCI
Canopy chlorophyll content index is often correlated with nitrogen content in plants because it attempts to account for both the proportion of nitrogen content (by using NDRE), and total canopy cover (by using NDVI). This is known as a two-dimensional index. This index is particularly useful for monitoring crop stress and can be used to assess relative nitrogen content.
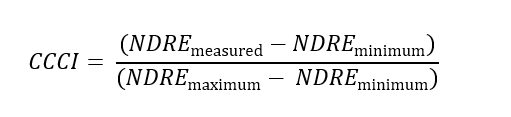
Minimum and maximum NDRE values are calculated based on an empirical relationship with NDVI.
Although CCCI is used as an indicator of nitrogen content, it can be difficult to separate the plant responses to low nitrogen and water stress.
Which index to use?
Each crop health index has their own advantages and the choice of which to use will depend on the intended use and where the data is obtained from.
Some indices, like NDVI, are freely available but at a resolution of 10 x 10m at best and only retrieves imagery at fixed intervals. For higher resolution imagery or alternative vegetation indices, data must be obtained and processed through service providers which result in additional costs.
It is worth carefully considering which index is the most appropriate (Figure 3). Some aspects to consider are:
- What type of crop is being observed and do you need to monitor crop health on a plant-by-plant basis? For this you may want high resolution data and a plant health index that does not saturate with high biomass.
- How often does the crop need to be monitored? Weekly satellite imagery may be appropriate for monitoring irrigation management, but crucial growth stages can be captured by aircraft or drones to do an accurate analysis of tree health.
- Is there a new management regime being trialled? For monitoring nitrogen levels, CCCI is the best indicator.
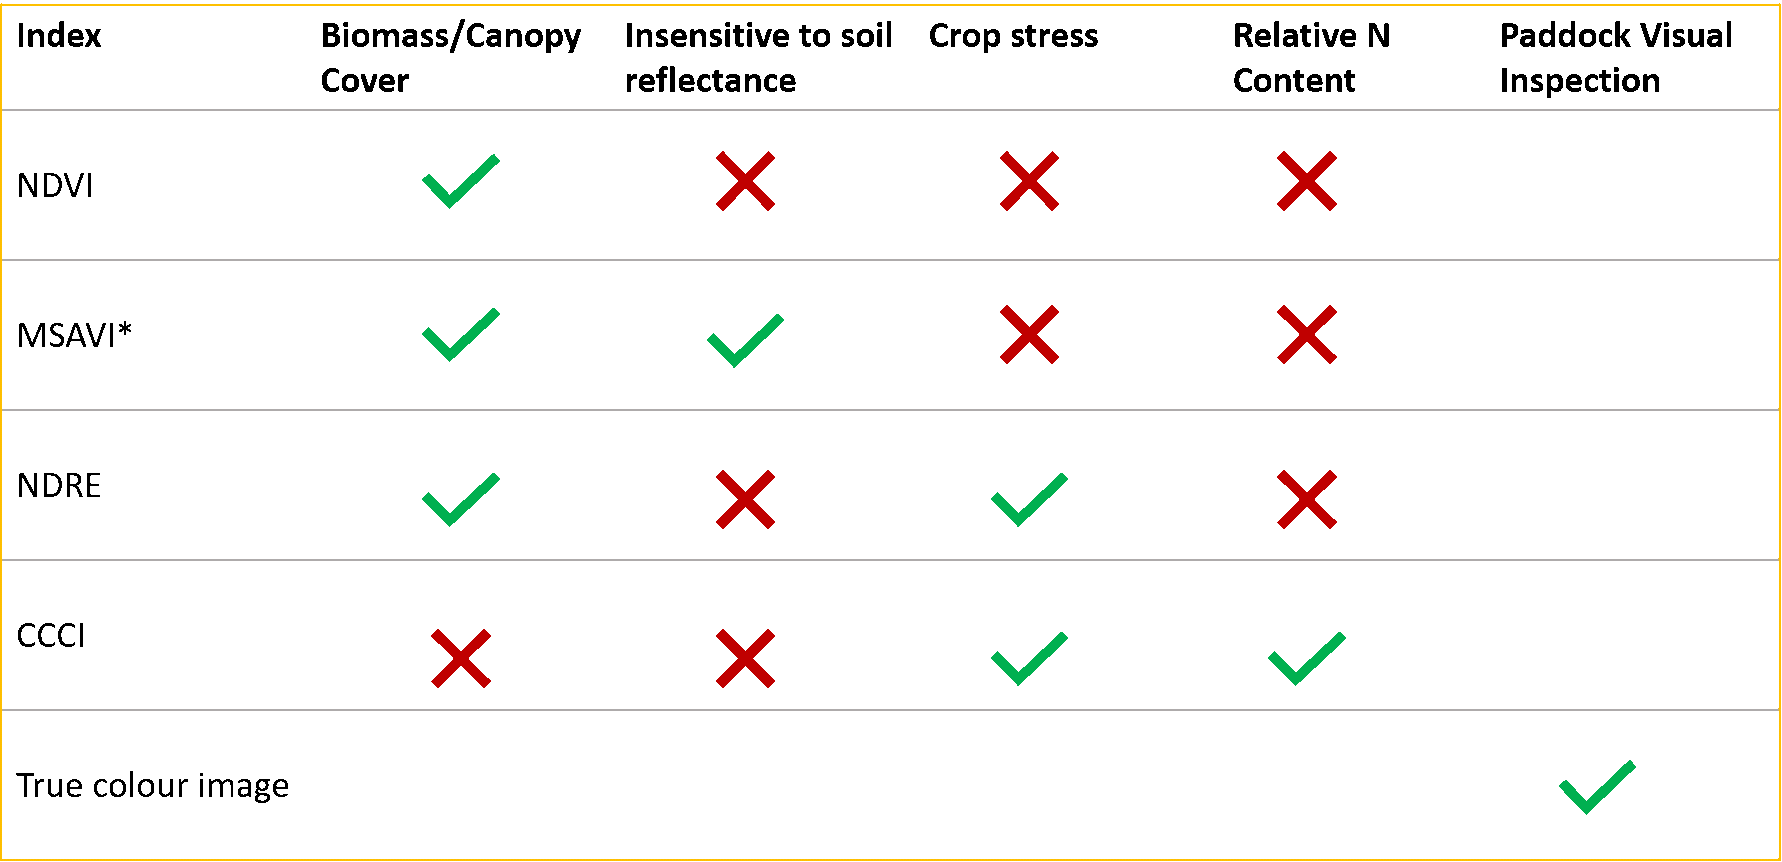
Figure 2. Comparison of different vegetation indices. *MSAVI is a soil adjusted vegetation index which accounts for light reflecting off bare soil. (Information courtesy of Marie Marion, FluroSat).
Remote sensing technology is powerful in determining spatial variation within paddocks and patches and can help identify problem areas before there are clear visible symptoms. However, it cannot diagnose the issue. Variability in crop health could stem from a range of issues including nutrient deficiency, uneven irrigation application, disease, pest infestation or soil constraints. On-ground checks and tests are necessary to effectively diagnose and treat an issue. However, looking at the trends between different areas, and when weaknesses begin to occur, remote sensing could help to propose a diagnosis.
Remote sensing and crop health indices are another tool in the toolbox of farm management. Its large spatial coverage and ability to track changes in crop health throughout time, across multiple growing seasons makes it a valuable tool. There is still significant development occurring in this space with more research being undertaken to understand the relationship between crop characteristics, like nitrogen content, and remotely sensed indices.
Content sources and further information
- Scheduling irrigation using ET0
- IrriSAT use and application for cotton growing webinar: https://www.youtube.com/watch?v=RKgc1pLtEkE
- Using remote sensing to monitor water and nitrogen: https://grdc.com.au/resources-and-publications/grdc-update-papers/tab-content/grdc-update-papers/2016/07/decision-making-from-above-using-satellite-and-drones-for-water-and-nitrogen-management
- About NDRE: http://citeseerx.ist.psu.edu/viewdoc/download?doi=10.1.1.463.8007&rep=rep1&type=pdf
- Understanding crop indices: https://www.youtube.com/watch?v=1kcUNdyIeaM