Wednesday, 26 February 2025
Weekly Irrigation Requirement$ Summary – Driving Water Productivity
Northern Victoria
This update provides ‘reference evapotranspiration’ (ETo) information to assist with improved irrigation scheduling for top yields and high water productivity.
Similar weather and irrigation scheduling information provided in this email that is updated daily for any Victorian location, including an interactive irrigation spreadsheet, is available on ExtensionAus.
No login or password is required to use this tool.
In this update:
- Weekly irrigation requirements summary
- Water commentary:
– Plan ahead for your water needs
– Water outlook 2025-26
– Updated Restoring Our Rivers Trading Strategy
– Links: Modernisation and digitalisation of irrigation in Italy.
Free Japanese encephalitis vaccinations.
VFF mental health handbook.
Leadership scholarships for women in farming.
Next 20 years will be transformational for agriculture. - Last week’s irrigation requirement
- Next week’s irrigation requirement
- Daily ETo and rainfall
- Soil temperature and moisture
- Seven-day forecast – Gunbower
1. Weekly irrigation requirements – summary
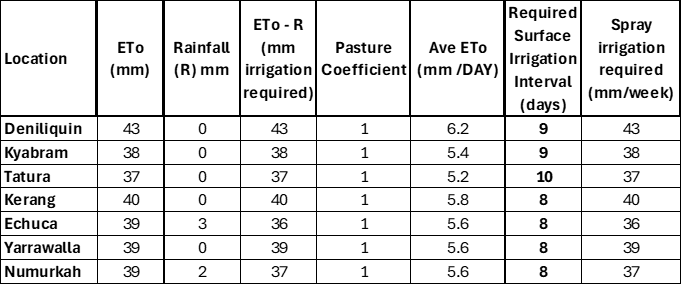
- Dashboard estimate: The required pasture surface-irrigation interval (40mm refill point) is 9 days based only on cumulative ETo for the past week (not including any rainfall), at Kyabram.
- The plant water requirement (irrigation and rainfall) for our reference crop of pasture (cumulative ETo) for the past 7 days was 38mm, at Kyabram.
- Cumulative ETo for the next seven days is forecast to be 49mm at Kyabram.
‘Water requirement’ for our reference crop of pasture (ETo) at Kyabram*.
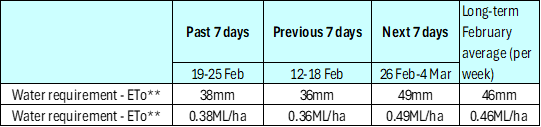
* See the tables and graphs below for ETo (and rainfall) at more locations.
** Rainfall is not included in these estimates. The figures presented are cumulative daily short crop reference evapotranspiration (ETo).
2. Water commentary
Plan ahead for your water needs
Now is a good time to review your water needs for the rest of this irrigation season and for 2025-26 and beyond. Given the water you currently have, and your likely water use over the rest of the season, will you need to purchase more water to get you through? What about next season?
Southern Basin water availability currently appears reasonable at 61% capacity, compared to a 10-year average of 63% for this time of year. There is also likely to be a significant volume of unused available water remaining in northern Victorian systems at the end of this season, despite high water use to date.
As well as purchasing water allocation on the spot market, this could be an opportune time to test out a water product you have never used before. Other than carrying over water against your own water entitlement, other options to increase your carryover volume include parking on someone else’s entitlement, or on leased, or purchased entitlement. Forward contracting water, and leasing or purchasing entitlement, are other options.
The best water product mix will depend on your unique situation, goals, and attitude to risk. Talking to your partner, neighbour, or water broker may help with decisions about how to best secure your future water needs.
Water outlook 2025-26
The Northern Victorian Resource Manager reported last week that the Murray, Goulburn, and Loddon systems should begin the 2025-26 water year with at least about 25% HRWS.
Average inflow conditions are required for 100% HRWS by mid-October 2025.
Considering the broader context of Southern Basin water availability, NSW is likely to release their water outlook for the NSW Murray and Murrumbidgee on 15 March.
If you are considering carrying over water into next season, the Resource Manager reported the risk of spill will depend on storage drawdown in the next few months. But the risk in the Victorian Murray system is expected to be around 50% in early July, 30% in the Goulburn, and 45% in the Campaspe.
If you are a little confused about how carryover and spill work, this Victorian Water Register Carryover Calculator tool allows you to test different scenarios for your own unique circumstances.
Updated Restoring Our Rivers Trading Strategy
The updated Restoring Our Rivers Trading Strategy released earlier this week provides information about water purchasing in 2025 towards the 450GL of additional environmental water. Water purchases will be made over 3 years.
A program to commence purchasing a further 100GL in the Southern Connected Basin for large portfolios of water (around 20GL or more), has been approved. The program will commence in February 2025.
The Trading Strategy will continue to be updated as further decisions about the Voluntary Purchase Program are made, including next steps for the Remaining Southern Connected Basin catchments.
Links:
- Modernisation and digitalisation of irrigation in Italy. Webinar recording.
- Free Japanese encephalitis vaccinations. Shepparton, Mooroopna, and Tatura.
- New VFF Mental Health Handbook.
- Leadership scholarships for women in farming.
- Next 20 years will be transformational for agriculture.
3. Last week’s reference evapotranspiration (ETo)
Pasture Irrigation Requirement$
Wednesday 19 February – Tuesday 25 February
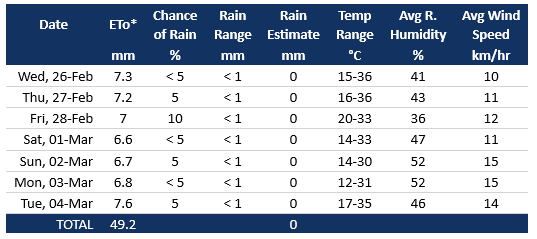
4. Next week’s forecast reference evapotranspiration (ETo)
Wednesday 26 February – Tuesday 4 March

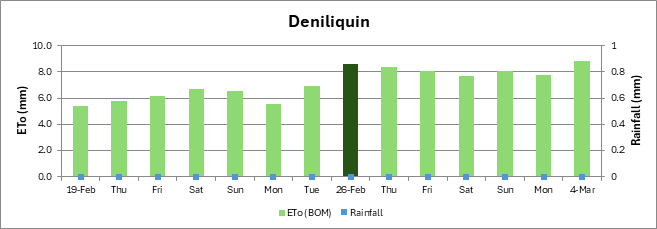
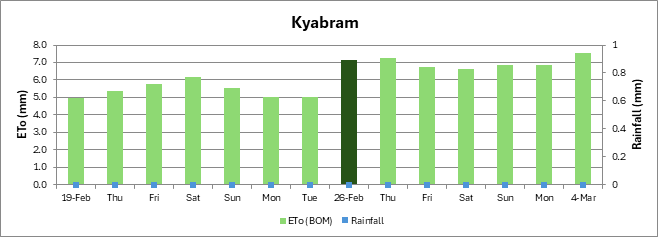
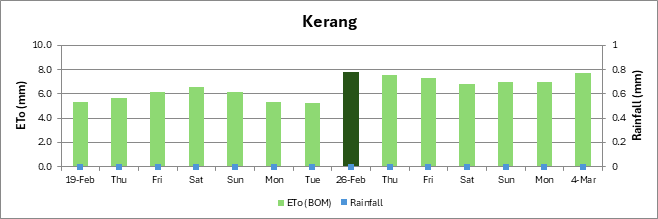
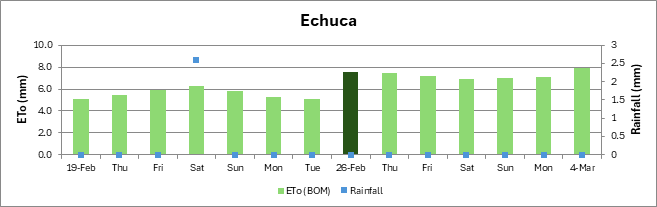
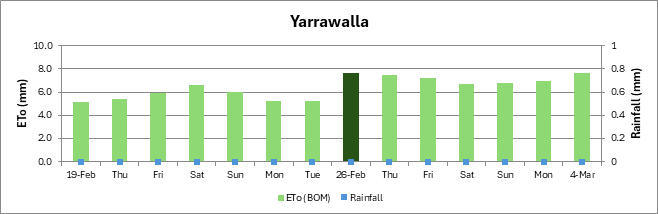
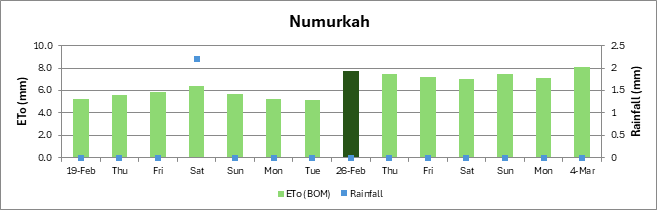
5. Daily evapotranspiration (ETo) and rainfall
Last week and next week

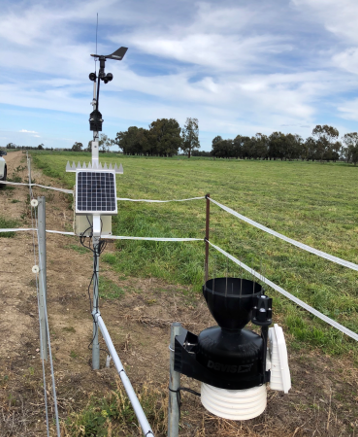
6. Soil temperature and moisture
The soil temperature measured by a capacitance probe at 9 am today (Wednesday) under surface irrigated annual pasture at 10cm depth at Wee Wee Rup (near Leitchville) was 24.27°C.
Soil temperature at Wee Wee Rup (oC)
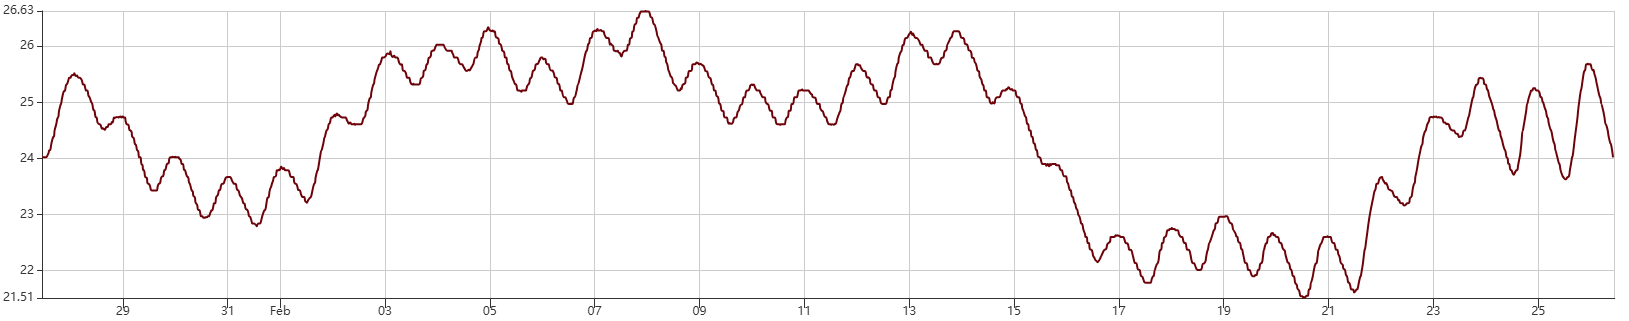
At Wandella (near Kerang) at 9 am this morning the soil temperature was 22.06°C at 15cm depth under irrigated lucerne.
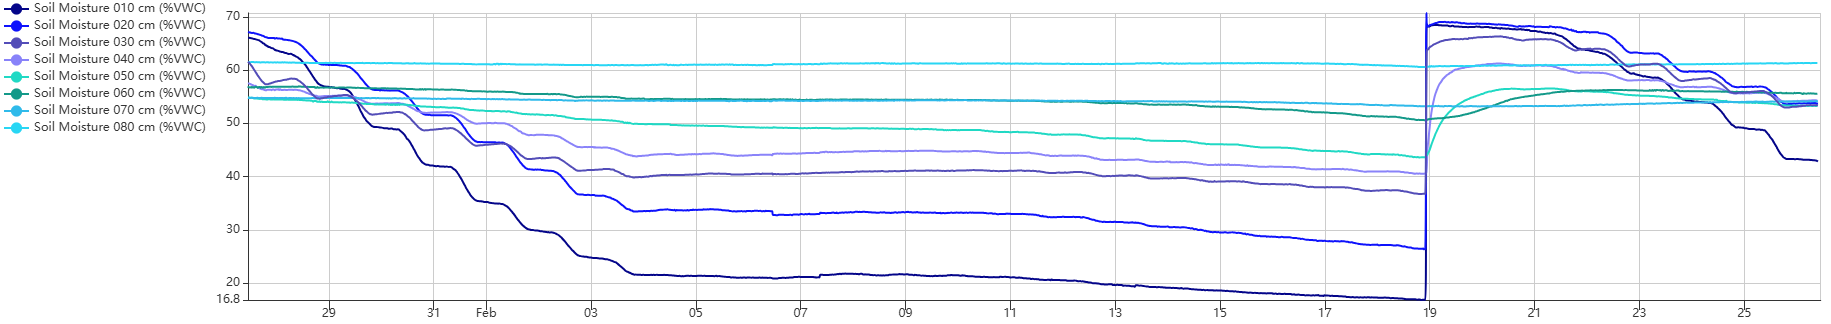
Soil moisture at Wandella under irrigated lucerne.
7. Seven-day forecast – Gunbower
Wind, temperature, humidity, rain, and ETo
Source: SWAN.
———————————-
Disclaimer
The intention of this service is not for the information to be used in isolation when making decisions about irrigation. ETo data provides another handy tool in your irrigation ‘tool box’ and needs to be used in conjunction with other preferred scheduling methods and updated weather information.
This publication is provided solely for information purposes and no representation or warranty is made as to its quality, accuracy, completeness, suitability or fitness for any particular purpose.
You should make your own inquiries as to its appropriateness and suitability for your circumstances.
The State of Victoria as represented by the Department of Energy, Environment and Climate Action (DEECA) accepts no duty of care and disclaims all liability in relation to use of this publication.
————————————
+ Reference evapotranspiration (‘ETo’). Refers to the evapotranspiration from an actively growing, well-watered, grass stand 120mm in height. Sourced from AgVic Online ETo Tool, which uses BoM AWO data. BoM AWO gridded daily historical ETo figures may change significantly over time, particularly in the first three days, because improvements are made to the dataset as more data is received by the BoM from different weather stations.
~ ‘Rainfall R.’ Historical rainfall data is sourced from BoM AWO. BoM AWO gridded daily historical rainfall figures may change significantly over time, particularly in the first three days, because improvements are made to the dataset as more data is received by the BoM from different weather stations. Where a rainfall event is less than 2 mm it is usually not ‘effective’ in terms of adding to the soil moisture reserve (because it is unlikely to penetrate through the crop canopy) and is unlikely to be listed in the tables,or graphs. Also be aware that any rain more than that which fills the soil root profile (run-off or deep percolation) is also not ‘effective’ from an irrigation perspective. Because rainfall can vary over short distances, you are encouraged to collect and use your own rainfall figures for your farm.
x ‘Dairy pasture crop coefficient.’ A crop coefficient refers to your crops relative water use potential. For crops other than pasture refer to Tech Note for discussion of an appropriate crop coefficient. Alternatively, you can use AgVic’s Online ETo Tool Interactive Spreadsheet which provides guidance on which crop coefficient to use for your crop and its stage of development.
^ The ‘Average (daily) ETo’ is simply calculated by dividing the total weekly cumulative ETo by 7 days.
@ To calculate the ‘Required surface irrigation interval’ it is assumed there is 40mm of ‘readily available water’ in the pasture root zone. e.g. Required surface irrigation interval = 40 mm ÷ average (daily) ETo, plus 1 day to allow for excess water to drain away following a surface irrigation event. The ‘Required surface irrigation interval’ is only a dashboard estimate based only on cumulative ETo over the recent 7 days, to suit the purpose of a weekly update.
For more accurate irrigation scheduling particularly in spring and autumn, the cumulative deficit (‘ETo – R’) since the last irrigation usually needs to be calculated over a period longer than 7 days and the irrigation timed when the readily available water (40mm in this case) is depleted.
> ‘Spray irrigators need/ed to apply.’ This figure is based only on evapotranspiration minus rainfall (‘ETo – R’) for the given week and assumes excellent accuracy in terms of mm water applied, spray uniformity, and application efficiency.
Typically spray uniformity will not be 100% and extra water will need to be applied to best meet plant needs. The ‘spray irrigators need/ed to apply’ figure given in the table also assumes the rainfall is effective and contributes equivalently to the soil moisture reserve, which may not be the case.
In practice, the moisture deficit (or reserve) carried into the season also needs to be considered to ensure there is adequate soil moisture for maximum plant growth and to avoid a ‘green drought.’ It is best to use rainfall measurements collected on your property. Typically, with pressurised irrigation systems, irrigations occur more regularly than with surface irrigation to optimise plant growth.
Due to the cumulative error involved with using ETo data over a period, it is important that other scheduling methods are used in conjunction with ETo data for spray irrigation systems.
¥ ‘Next week’s forecast reference evapotranspiration – pasture irrigation requirement.’ Forecast ETo and rainfall data is sourced from AgVic’s online ETo tool, which uses forecast daily ETo data from BoM’s Gridded Evapotranspiration Products derived from the Australian Digital Forecast Database (ADFD). Forecast rainfall is also from BoM’s ADFD.
———————————————————
ETo data and associated irrigation information for the locations shown in these updates is updated daily and can be accessed on the Online ETo Tool.
Historic daily ETo and rainfall data is sourced from BoM’s gridded Australian Water Outlook service.
Historical daily ETo and rainfall figures may change significantly over time, particularly in the first three days, because improvements are made to the dataset as more data is received by the BoM from different weather stations.
Forecast daily ETo data is from BoM’s Gridded Evapotranspiration Products derived from the Australian Digital Forecast Database (ADFD), which AgVic receives on a ‘fee for service’ basis.
Forecast rainfall is also from the ADFD. Please visit AgVic’s online ETo Tool for updated ETo and rainfall data for your location.
Tip: To convert mm to megalitres /ha, divide by 100. E.g. 50mm = 0.5ML /ha.
Important: The ‘required surface irrigation interval’ shown in these tables is a ‘dashboard estimate’ and is calculated using cumulative ETo only over seven days and needs to be considered in conjunction with rainfall on your farm.
Because rainfall can vary over short distances, please collect and use your own rainfall measurements. The rainfall figures in the tables are only a guide.
For more information about selecting an appropriate crop coefficient for your particular crop and its stage of development refer to this Tech Note What is evapotranspiration and how do I use it to schedule irrigations?, Ag Vic’s Online ETo Tool Interactive Spreadsheet, or the scientific booklet (FAO56) – Table 12, Chapter 6.
